The Puerto Rico Children Vulnerability Index, 2021
Sections
Executive Summary
Introduction
Data and Methods
Apply statistical analysis to the CVI
Conclusion
Acknowledgements
Executive Summary
Recent natural hazards and resulting disasters in Puerto Rico have drawn attention to the social vulnerability of children in the archipelago. We created the Child Vulnerability Index (CVI) to identify the scale and patterns of child vulnerability in the archipelago, and provide insights to mitigate the effects that hazardous events may cause. The index was created using 2017-2021 American Community Survey (ACS) data pertaining to three broad themes: Personal characteristics of children, Characteristics of households with children, and Overall household characteristics for all Municipios, Barrios, and Census Tracts in Puerto Rico. The CVI is a two-pronged tool consisting of an ESRI Enterprise dashboard and open source Python code that enables stakeholders to improve their understanding of the vulnerability of children in the archipelago and improve their resilience to hazardous events. Our analysis shows that the Municipio with the highest overall CVI in 2021 was Jayuya and the Barrio with the highest CVI in 2021 was Barrio Pueblo in Comerío. All Municipios except Culebra had at least one Barrio with CVI greater than 0.5, and 59 out of the 78 municipios in the archipelago had Barrios with CVIs in all quartiles. These results showcase the widespread and geographically uneven distribution of child vulnerability in Puerto Rico. We performed statistical hypothesis testing to examine statistical evidence for regional differences in relative child vulnerability at Municipio, Barrio, and Census Tract level. The results show that children living in the Municipios, Barrios, and Census Tracts in the Vega Baja Operational Zone of the Negociado para el Manejo de Emergencias y Administración de Desastres (NMEAD), collectively experience greater relative vulnerability than children living elsewhere. Researchers have noted several limitations to the use of Social Vulnerability Indexes (SVI) for disaster management and response. Notwithstanding these limitations, the development of the Child Vulnerability Index is a step towards understanding and quantifying the child vulnerability landscape in Puerto Rico.
Introduction
Children in Puerto Rico – here defined according to the U.S. Census Bureau as all persons below the age of 18 – have traditionally been overlooked by academics and policymakers in the archipelago and in the U.S., which has led to the marginalization of an already vulnerable population group. Recent events in the archipelago have drawn attention to children and the effects social conditions such as family structure, living arrangements, and migration can have on their capacity to cope during situations of distress, as in the case of hurricanes or earthquakes. Natural hazards and resulting disasters, which are expected to become more common as the planet warms, are known to exacerbate or create psychological distress and mental health emergencies among young people. Children, who will bear the burden of the future effects of climate change, face today’s challenges while not having fully developed their physical and emotional capacities and relying on adults for their safety and well-being.
In Puerto Rico, children have experienced outstanding levels of poverty for decades. According to the U.S. Census Bureau, in 2021, 18.0% of the total population in Puerto Rico was below the age of 18. Of that age group, 56.3% lived below the federal poverty level, the highest percentage across the United States. Simultaneously, 62.2% of children in the archipelago lived in households with one parent present while 56.2% lived in households receiving some form of public assistance. Of the children-aged population, 8.3% lived with some type of disability. Of those children living in households, 14.7% had no access to a vehicle, 8.0% had no access to the internet, and 8.3% had no access to a computer. These social vulnerabilities experienced by children in Puerto Rico are a symptom of the structural failures of local and federal governments to meet the basic needs of those who are most marginalized. Social vulnerabilities are understood as the socioeconomic and demographic characteristics that affect a person or group’s resilience. They are known to increase susceptibility to adverse outcomes of hazardous events limiting individual’s capacities to prepare, withstand, and recover from disasters. Social vulnerabilities are dynamically complex phenomena that exhibit varying spatial and temporal patterns.
Among the social vulnerabilities that children in the archipelago experience, poverty remains the determinant factor influencing their overall well-being. Growing up in poverty can have negative health, educational, and employment consequences throughout a person’s lifetime. Nevertheless, governments have the capacity to implement public policies to reduce poverty among children and lessen their vulnerabilities. Across the globe, children face a number of hazardous scenarios due to climate change and environmental degradation. For example, in recent years, hazardous events, including the COVID-19 pandemic, have sparked mental health emergencies among young people (including children), prompting an advisory notice by the U.S. Surgeon General to protect youth mental health. Identifying where and how children are vulnerable is important when responding to the global climatic crisis and local hazardous events.
In Puerto Rico, while much post-disaster research on children has focused on mental health effects, less has focused on how the vulnerabilities of children vary across the archipelago. Identifying the scale and patterns of child vulnerability in the archipelago can provide valuable insight in mitigating the effects that climate change and other hazardous events may cause. To this end, the Center for Puerto Rican Studies, in collaboration with the U.S. Census Open Innovation Labs’ Opportunity Project 2022 Sprint, developed the Puerto Rico Child Vulnerability Index for 2021 (CVI). Vulnerability Indexes are widely used measures by policy makers and those who seek to reduce vulnerability in the face of disaster. The CVI is a multifaceted tool consisting of an interactive dashboard and open sourced Python code, which provides users with granular information at multiple geographic levels and the flexibility to generate broader analyses. This will allow communities, state and federal government agencies, and on-the-ground organizations to identify and map regions where children might be at higher risk or in need of support before, during, and after hazardous events. With this Puerto Rico Child Vulnerability Index we seek to equip practitioners to enhance family and community resilience and preparedness in the advent of future disasters and the effects of global climate change.
In subsequent sections, this report describes the variables that comprise the CVI as well as the methods used to construct the index. We then demonstrate how the CVI can be used by showcasing its applicability in dashboard form and discussing CVI results across the landscape at different geographic levels. Finally, we show how the code used to create the index can be expanded and leveraged to extract insights about child vulnerability in Puerto Rico that local stakeholders may employ in risk mitigation and disaster preparedness efforts.
Data and Methods
The Puerto Rico Child Vulnerability Index for 2021 (CVI) is a measure of the relative vulnerability of children in the archipelago. The CVI is a child-targeted adaptation of the Social Vulnerability Index (SVI) developed by the Center for Disease Control and Prevention (CDC) in collaboration with the Agency for Toxic Substances and Disease Registry (ATSDR). The SVI measures the capacity communities have to prepare and respond to natural or anthropogenic events, which may be affected by certain social conditions, including poverty, age composition, and disability. Similarly, the CVI provides social and spatially relevant child-targeted information for use in emergency preparedness and response. Indexes such as the SVI are widely used in the field of disaster management. Nevertheless, use of nationwide indexes may result in parameters that do not correspond to the realities of determined locations, as in the case of Puerto Rico.
Emergency planning and disaster mitigation requires identifying socially vulnerable areas and communities. Geographic scale greatly influences the capacity to identify the location of vulnerable population groups and reveal patterns of vulnerability. While the SVI is geared towards Census Tract level analysis, the CVI proposes a multi-level approach that spans three distinct geographic levels: Municipios, Barrios, and Census Tracts. Census Tracts are statistical subdivisions of counties with demographically homogeneous populations, ranging from 1,200 to 8,000 people, for which the U.S. Census Bureau collects statistical data. Census Tracts are commonly used in the U.S. for government planning and policy. As in the U.S., Census Tracts in Puerto Rico have the capacity to reveal geographic patterns that can improve public policy and emergency response. Nevertheless, Census Tracts may not be representative of local community boundaries upon which people commonly organize themselves. In this scenario, information aggregated at the Municipio or Barrio level may better serve the needs of communities and disaster managers in the archipelago. In Puerto Rico, Municipios are the primary legal divisions and are treated as county equivalents for statistical purposes. Municipios have functioning governmental units and have shown to have the capacity to provide immediate disaster response, even when the central government fails to. Barrios, or County Subdivisions, are administrative divisions of Municipios that more closely represent the geographic boundaries upon which Municipios are divided and locals organize themselves. Creating the CVI at three geographic levels provides stakeholders with information that allows them to identify patterns and more closely distinguish those who suffer the impacts of disaster the most.
Data
The variables used to construct the CVI are classified along three broad themes: Theme 1 – Personal Characteristics of Children, Theme 2 – Characteristics of Households with Children, and Theme 3 – Overall Household Characteristics (See Figure 1). Variable selection followed literature on children vulnerability and the variables used in the SVI. The variables selected were further analyzed with scholars and on the ground workers participating in The Opportunity Project 2022 Sprint. The variables are meant to characterize the population of children at Municipio, Barrio, or Census Tract level, as well as to describe qualities of their caretakers and their communities at large. A list of the variables used and a description of each variable can be found in Appendix B of this report.
Theme 1 describes the social and economic characteristics of children and consists of 1) Child Population Percent, 2) Child Poverty Percent, 3) Child Disability Percent, 4) Child Healthcare Uninsurance Percent, and 5) Percent of Children Not Enrolled in School. Poor socioeconomic conditions for children as they grow up have been linked to poor health outcomes, including physical and cognitive impairment, low educational attainment, and negative employment outcomes. The vast majority of children do not live on their own, but rather in households and families. Thus, children living in poverty are subject to household and family economic conditions, which may either hinder or support their capacity to prepare and recover after hazardous events. The presence of children with disability increases vulnerability because many require assistance, which may not be provided during a crisis. Lack of healthcare insurance also increases the vulnerability of children because they may not be able to receive medical assistance if they are injured and their family is incapable of covering the costs.
Figure 1. The Puerto Rico Child Vulnerability Index 2021

Theme 2 describes the characteristics of households with children and consists of: 1) Percent of Children in Households with Grandparents and No Parent Present, 2) Percent of Children in Households with One Parent Present, 3) Percent of Children in Households Receiving Cash Assistance, 4) Percent of Children in Households with No Internet, 5) Percent of Children in Households with No Computer. Children are dependent on their families and communities for economic well-being. Household and family structure have been found to be key determinants of children’s poverty and vulnerability. Children and elders are among the most vulnerable population groups because they are more likely to depend on other members of their families or communities. Children living with grandparents are among the poorest in Puerto Rico and are highly vulnerable to hazardous events because both children and grandparents can be dependent on others. Similarly, children living in households with one parent, particularly single mothers, are more likely to live below the poverty level, which hinders their capacity to cope during a disaster. Other household characteristics such as lack of computer or internet access also limit the capacity of households to withstand disasters by inhibiting communication and access to vital information. Disruption of life after a disaster can have detrimental effects on children’s academic functioning and overall well-being. Following recent natural hazards that affected the archipelago, reports have shown that children have had to continue their education under distress while lacking adequate equipment to perform school work.
Theme 3 encompasses overall housing and community characteristics and consists of: 1) Percent of Housing-Cost-Burdened Households, 2) Percent of Civilian Population Unemployed, 3) Percent of Occupied Housing with Overcrowding, and 4) Percent of Occupied Housing with No Vehicle. While children are mostly dependent on their immediate families, the conditions of their communities impact disaster preparedness and response. The variables that comprise Theme 3 are closely related to wealth, as communities with populations experiencing high housing-cost-burden or high unemployment are more likely to be poor and not be able to cope when disaster occurs. Similarly, overcrowding can cause heightened vulnerability, particularly in densely populated areas where large evacuating crowds can be dangerous. A low rate of automobile ownership in a community also hinders evacuation efforts, thus increasing their vulnerabilities and putting their lives in danger.
Methods
Following the methodology proposed for the CDC SVI, each of the fourteen variables listed above were ranked from lowest to highest across all Municipios, Census Tracts, and Barrios where a higher rank indicates greater relative child vulnerability. All data used to calculate the fourteen variables were extracted from the U.S. Census APIs for 2017-2021 American Community Survey (ACS) 5-year estimates using custom written Python code. Municipios, Census Tracts, and Barrios where the number of children living in households was equal to zero were excluded from the ranking process. According to 2017-2021 ACS 5-year estimates, 845 out of the 939 Barrios had children living in households, 919 out of 981 Census Tracts had children living in households, and all 78 Municipios had children living in households. Barrios and Census Tracts that were removed for the ranking process were added back into the database after ranking and assigned null CVI values.
Percentile ranks were then calculated across all three geographies – Municipios, Barrios, and Census Tracts – for all fourteen individual variables. Percentile ranks for all variables were summed within each theme and percentile ranks were calculated again on the resulting sum to generate percentile ranks for each theme for all Municipios, Barrios, and Census Tracts. Then, to generate the overall CVI for each Municipio, Barrio, and Census Tract, the values generated for each theme were summed and a percentile rank was calculated for the resulting value. The resulting CVI indicated the relative child vulnerability of each Municipio, Barrio, and Census Tract on a scale of 0 to 1, where a value of 1 represented the highest relative child vulnerability. To analyze the results, the CVI was broken down into quartiles, with scores less than or equal to 0.25 indicating low children vulnerability, scores greater than 0.25 and less than or equal to 0.50 indicating low-medium children vulnerability, scores greater than 0.5 and less than or equal to 0.75 indicating medium-high children vulnerability, and scores greater than 0.75 indicating high vulnerability. Municipios, Barrios, or Tracts that rank lower do so in comparison with the rest of the Municipios, Barrios, or Tracts in the archipelago, respectively, but are not exempt from being vulnerable within specific themes or determined characteristics.
The code used to obtain the data, calculate the variables, and generate the CVI has been made available via GitHub and can be found at The Center for Puerto Rican Studies’ CVI project website.
Leveraging the tool
The CVI was created to help communities, state and federal agencies, and local organizations improve their understanding of the vulnerability of Puerto Rican children in the archipelago and improve their resilience to hazardous events. To facilitate access and use, the index was mapped and built into an ESRI Enterprise Dashboard. The dashboard allows users to choose between English or Spanish, and can be accessed through a computer or mobile device. Users also have the capability to switch between geographic levels, and apply different filters to target specific areas. The dashboard provides users with the overall CVI, all three individual theme indices, and the values of the variables used by theme for the selected geography. Detailed tutorials of how to use the tool and how to access it can be found in CENTRO’s CVI website along with a link to the code used to gather the data and generate the index. Users with the technical knowledge can adapt and modify the code to conduct further descriptive and statistical analyses at distinct geographic regions, as shown later in this section.
Extracting insights from the Dashboard
Users of the CVI Dashboard are initially prompted with an overall view of children’s vulnerability in the archipelago at the Municipio level. Figure 2 shows that, at the Municipio level, there is a concentration of high vulnerability across the Central region and parts of the South. The top 15 Municipios with the highest CVI are Jayuya (1.00), Barranquitas (0.99), Mayagüez (0.97), Manatí (0.96), Cataño (0.95), Ponce (0.94), San Juan (0.92), Peñuelas (0.91), Maricao (0.90), Arroyo (0.880), Comerío (0.87), Orocovis (0.86), Corozal (0.85), Naranjito (0.83), and Santa Isabel (0.82). Seven of the top 15 Municipios are in the Central region, followed by four in the South, two in the Metro, one in the West, and one in the North. For many of these Municipios the social vulnerabilities of children may be compounded with physical hazards such as landslides or flooding. Municipios that rank low in the CVI still have vulnerable children populations and endure physical hazards. Consider the Municipios of Rincón and Culebra, which in Figure 2 are shown to rank low in the CVI. While it may be that the social characteristics used to develop the CVI result in low vulnerabilities for the two Municipios, Rincón has experienced significant shoreline erosion for decades, and experiences storm surge both during the hurricane season and during the winter period. Meanwhile, Culebra, which also faces a number of natural hazards, has an inadequate transportation system to and from the mainland and lacks basic infrastructure like a hospital or medical center.
Figure 2. CVI at the Municipio level, 2021
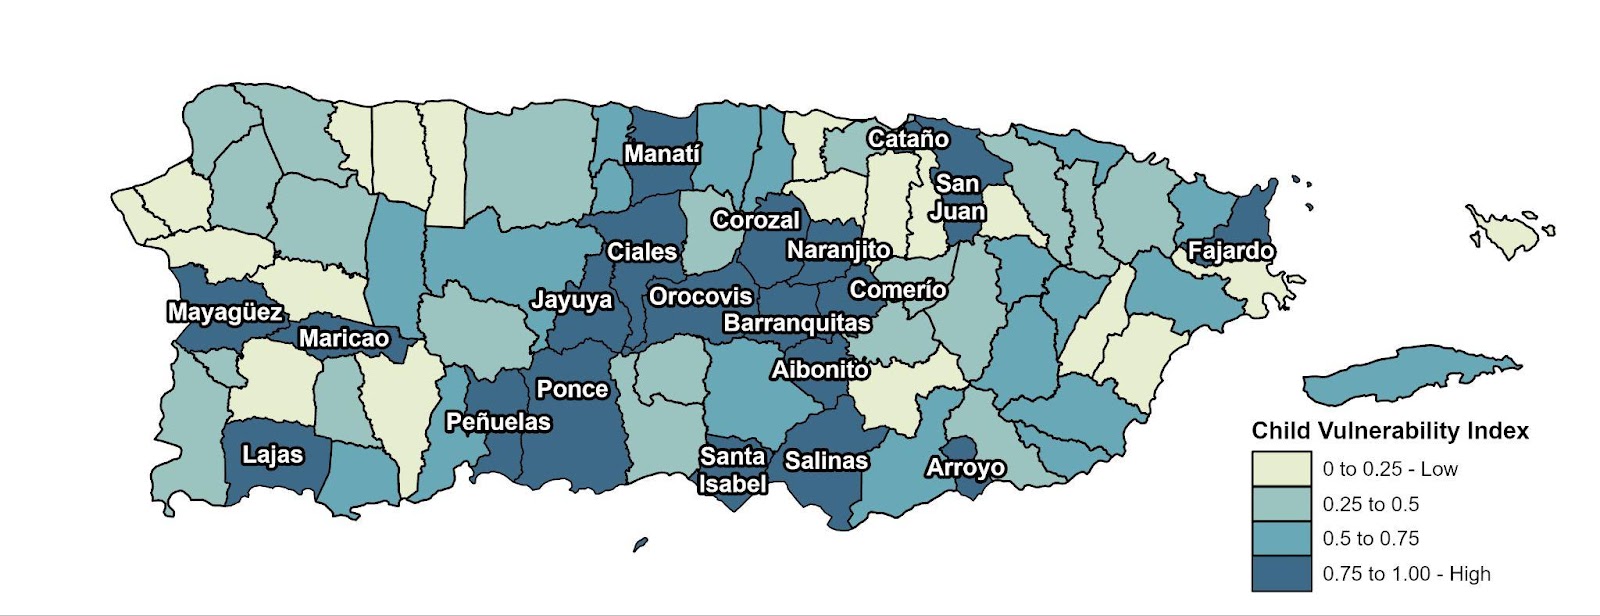
Source: U.S. Census Bureau, 2017-2021 American Community Survey, 5-year estimates.
Understanding vulnerability at the Municipio level is useful for state agencies to take initial action and allocate resources. Nevertheless, the information provided may be insufficient to identify particular communities where children are most vulnerable or experience particular vulnerabilities. Dashboard users interested in identifying particular communities in a predetermined region or exploring the landscape of vulnerability at lower geographies can select between Census Tracts and Barrios to further their analyses.
When assessing the CVI at the Barrio level, we find that 5 of the top 15 Barrios by CVI are located in the North region of the archipelago, three are located in the South, three in the West, two in the Metro region, two in the Central region, and one in the East. By exploring children’s vulnerability at lower geographies, different spatial patterns from the ones observed at the Municipio level become evident. As seen in Figure 3, many Barrios in the North and Metropolitan regions have medium-high to high CVIs, and all Municipios except Culebra have at least one Barrio with CVI greater than or equal to 0.5. Moreover, 59 out of all the 78 Municipios have Barrios with CVIs in all quartiles, showcasing the widespread and geographically uneven distribution of child vulnerability across the archipelago.
Figure 3. Child Vulnerability Index at the Barrio level, 2021
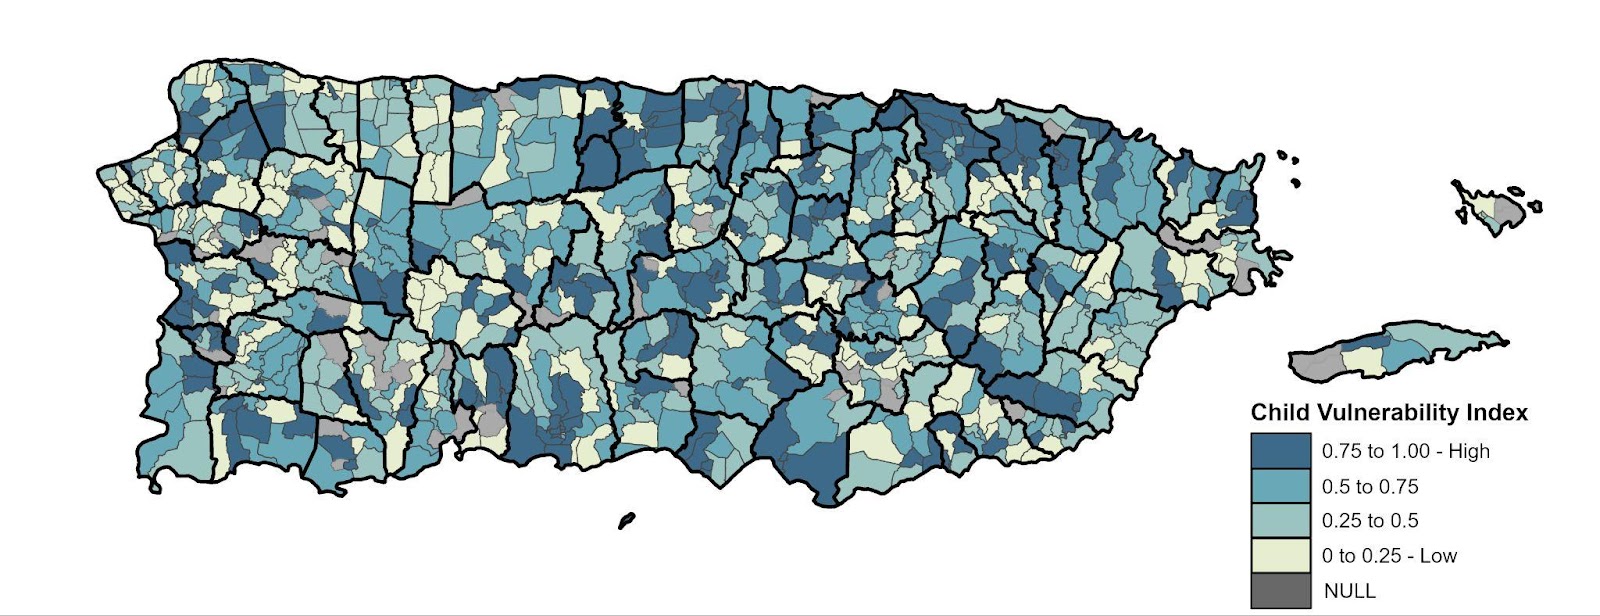
Source: U.S. Census Bureau, 2017-2021 American Community Survey, 5-year estimates.
The CVI Dashboard not only provides the overall CVI, but also includes detailed information of the variables used to build the CVI and that describe the population within each geographic boundary. In 2021, the Barrio with the highest CVI was Barrio Pueblo in the Municipio of Comerío. Comerío is located in the Central region of Puerto Rico and consists of nine Barrios: Cedrito, Cejas, Pueblo, Doña Elena, Naranjo, Palomas, Piñas, Río Hondo, and Vega Redonda (Figure 4). It is located along the Cordillera Central of the archipelago near the Río de la Plata, which bisects the Barrio. Due to this proximity to the river and surrounding topography, riverine flooding resulting from intense precipitation and flash flooding present significant risk in the event of future hazardous events.
At the Municipio level, Comerío had a total population of 18,990 in 2021, of which 19% were under 18 years old (3,591). The CVI for the Municipio is 0.87, which is among the highest in the archipelago. Within Comerío, 73% of the children live below poverty, 73% live with one parent in the household, and 70% live in a household receiving cash assistance. Children in Comerío also experience a lack of internet and computing needs: 16% have no access to a computer in their homes and 17% do not have access to the internet.
Three of the nine Barrios in Comerío have a CVI greater than 0.90: Barrio Pueblo, 1.00; Palomas, 0.93; and Naranjo, 0.92. Barrio Pueblo is Comerío’s main downtown area and includes the Municipio’s administration offices, schools, and emergency response teams (police, fire, and EMTs), as well as local businesses. Of the total population in Barrio Pueblo in 2021, 25% was under the age of 18 years; of them, 94% lived below poverty, 2% did not have health insurance, and 2% had some form of disability. Lastly, 14% of the school-age population (children aged 3 to 17 years old) was not enrolled in school, which is relatively higher compared to other Barrios in Puerto Rico.
Figure 4. Comerío by Barrio Child Vulnerability Index, 2021
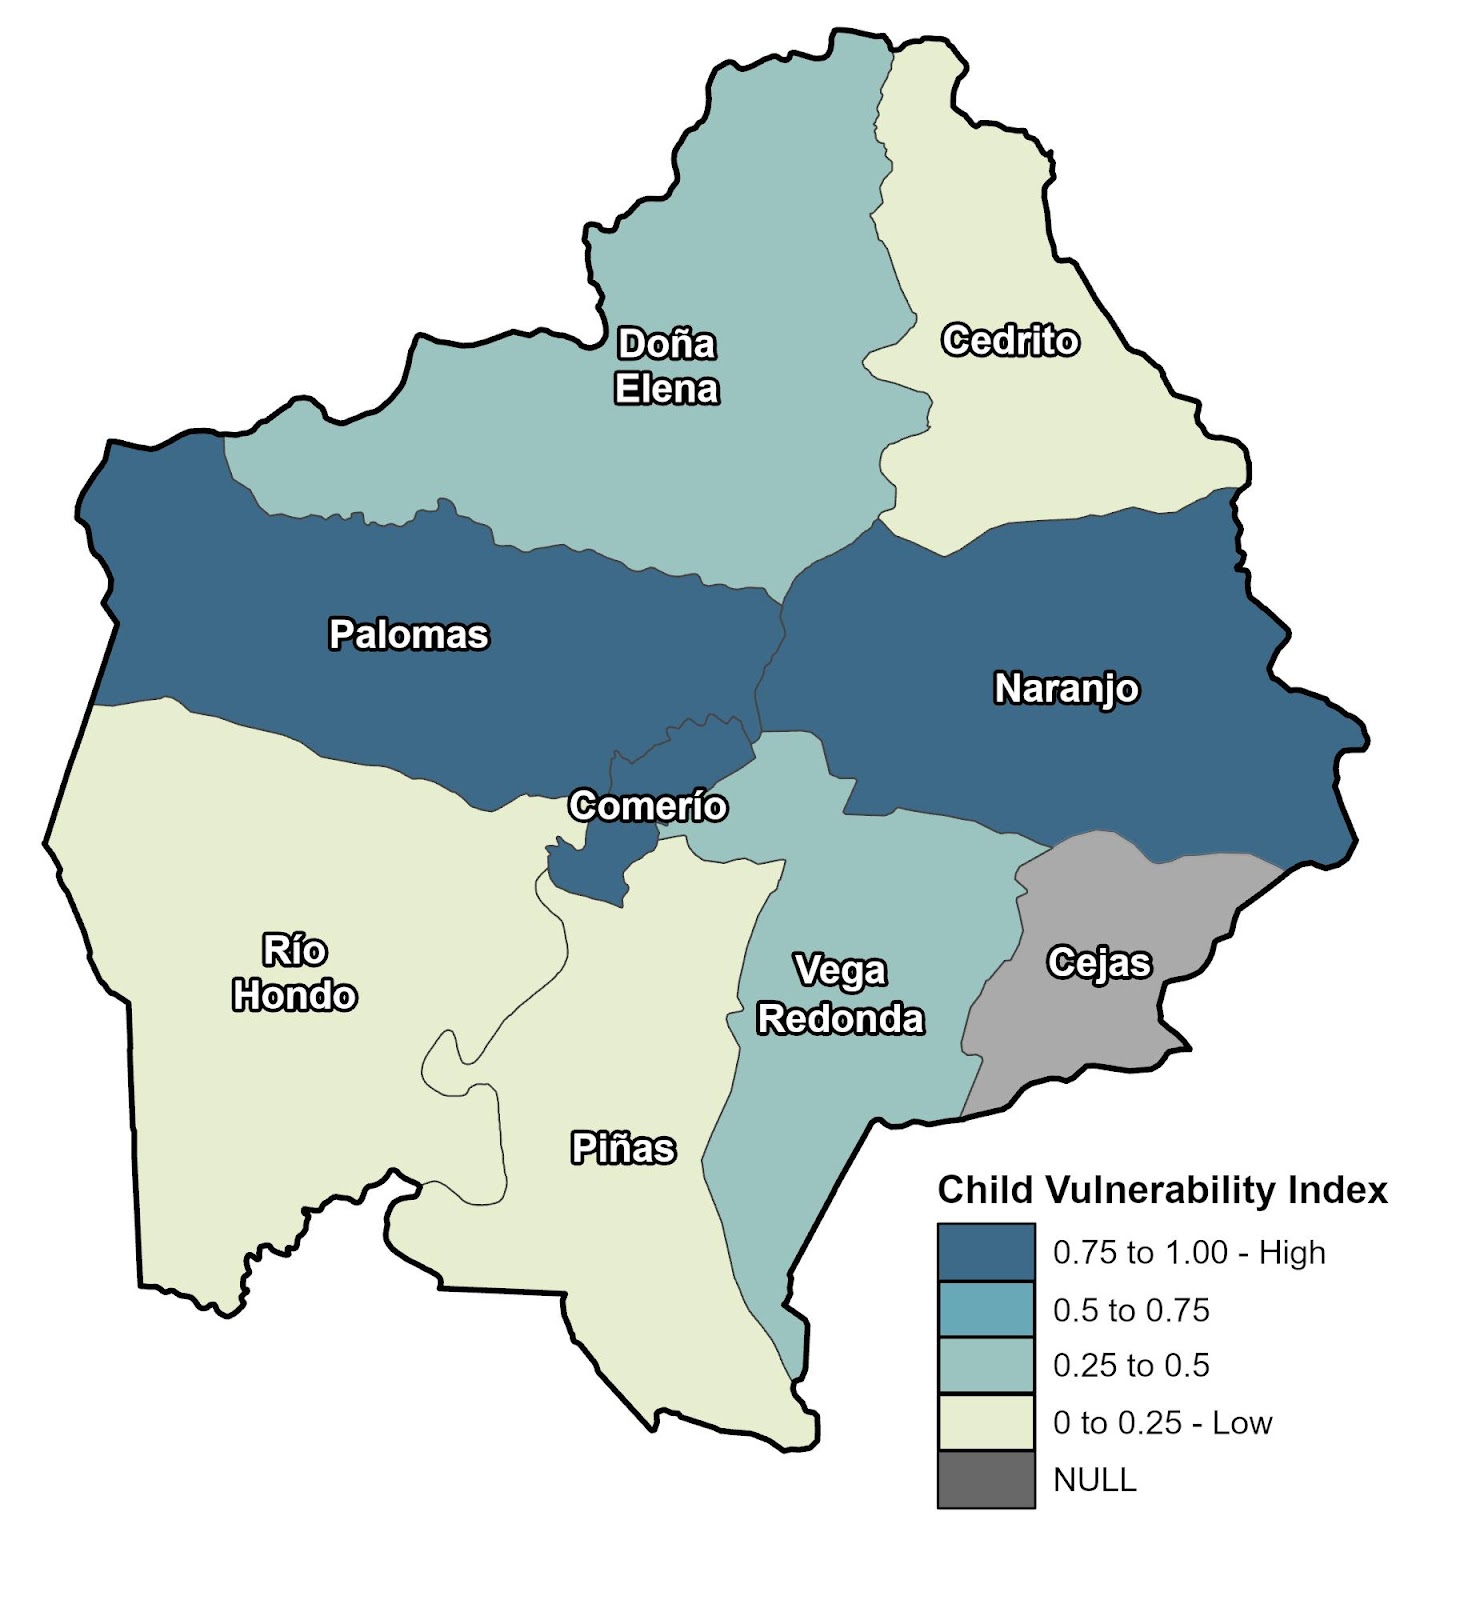
Source: U.S. Census Bureau, 2017-2021 American Community Survey, 5-year estimates
Among children living in households in Barrio Pueblo, 5% lived with a grandparent without the presence of a parent, 98% lived in a one-parent household, 78% lived in households receiving SSI or cash assistance, at least 33% of children lived in households without a computer available, and 24% lived in households without any internet access. Of the overall population living in Barrio Pueblo, at least 4% lived in overcrowded households, 35% of occupied housing units lacked a vehicle, 17% were living in housing cost-burdened homes, and 12% of the Barrio’s population was unemployed.
The profile of the children population in Barrio Pueblo described above through the variables used to build the CVI points towards a population in need of assistance and highly vulnerable in case a disaster occurs. While Barrio Pueblo is the most vulnerable Barrio relative to all Barrios in Puerto Rico, it is important to note how child vulnerability manifests across themes. Different rankings across themes provide a clearer picture of the needs of children within determined areas and point towards best policies to improve their conditions. In the case of Comerío, Barrio Pueblo has the highest overall CVI while Naranjo ranks highest in Theme 2 – Characteristics of Households with Children. This suggests that lowering the vulnerabilities of children in Naranjo would require policies that target household needs such as infrastructure or increasing government assistance. In case of an emergency, children may be left to care for their grandparents, and streams of income into the household may be limited if the single householder loses employment or if access to government assistance is interrupted. In an event like the COVID-19 pandemic, children in Naranjo are more likely than children in Barrio Pueblo to find themselves caring for older household members, dealing with lack of basic necessities due to lost of household income, and struggling to continue their daily routines and education because of lack of internet or computer access, according to the index for Theme 2. These disruptions may hinder their mental health during moments of distress.
Apply statistical analysis to the CVI
As mentioned above, the CVI tool includes the ESRI Enterprise dashboard and open sourced Python code written to extract the data from the U.S. Census, define the fourteen variables, and construct the CVI for each Municipio, Barrio, and Census Tract in Puerto Rico. To demonstrate how the code could be customized for targeted use by local government decision makers, we augmented the code to compare the CVI of different regions of the archipelago by performing statistical analysis, including statistical hypothesis testing. In Puerto Rico, the government agency tasked with emergency management response is the Negociado para el Manejo de Emergencias y Administración de Desastres (NMEAD). Under Puerto Rico’s Law 20-2017, NMEAD is responsible for implementing and maintaining the 2021 Puerto Rico All-Hazards Plan (PRAHP). This plan establishes processes to coordinate emergency management program operations across the archipelago. As shown in Figure 5, NMEAD has split Puerto Rico’s municipios into ten different Operational Zones, each reporting to NMEAD’s Commissioner.
Figure 5. NMEAD Operational Zones

Source: Negociado para el Manejo de Emergencias y Administración de Desastres (NMEAD).
To demonstrate how NMEAD could leverage the CVI to assess risk to the children population in Puerto Rico, we analyzed the socioeconomic profile of all the NMEAD Operational Zones by child vulnerability variable theme. Then, using statistical hypothesis testing, we compared the mean CVI of Municipios, Barrios, and Census Tracts within an Operational Zone to the mean CVI of Municipios, Barrios, and Census Tracts within all other Operational Zones. Such analysis can provide actionable insights to inform pre-disaster risk mitigation efforts for the child population in Puerto Rico, as well as post-disaster resource allocation and emergency responses specifically targeted to children.
In 2021, there were an estimated 597,277 children in Puerto Rico. As shown in Figure 6, nearly a quarter (23.8%) of Puerto Rico’s population under 18 years old resided in the San Juan Operational Zone (142,001 children), which is composed of the municipios of San Juan (58,165 children), Bayamón (31,563), Guaynabo (13,972), Toa Baja (13,808), Toa Alta (12,895), Dorado (7,160), and Cataño (4,438). The NMEAD Operational Zone with the second largest children population is Ceiba, which is home to 12.3% of children in the archipelago (73,455 children). The Ponce Operational Zone contains 10.6% of the children-age population with 63,413 children, followed by the Caguas Operational Zone, which contains 9.1% of the children-age population, with 54,471 children. Humacao (8%), Arecibo (7.8%), Vega Baja (7.8%), Aguadilla (7.5%), Mayagüez (6.6%), and Guayama (6.4%) represent the Operational Zones that contain the least children-aged population.
Figure 6. Percent of Child Population by NMEAD Operational Zone
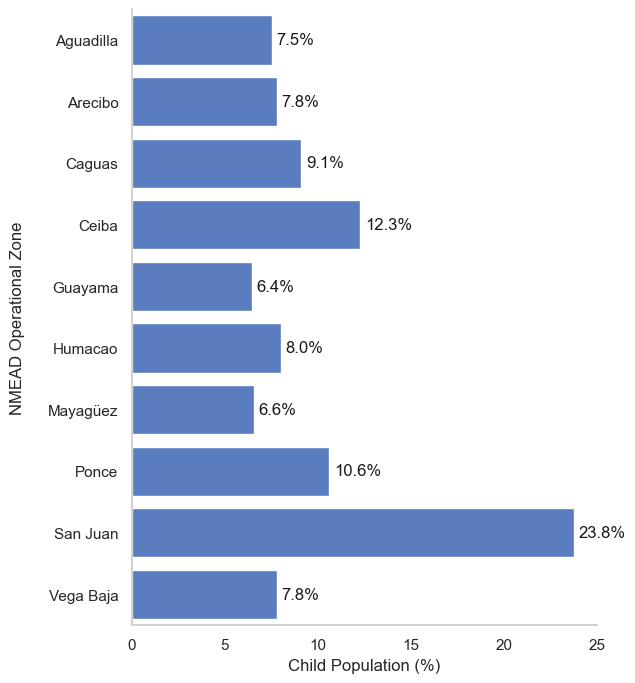
Source: U.S. Census Bureau, 2017-2021 American Community Survey, 5-year estimates.
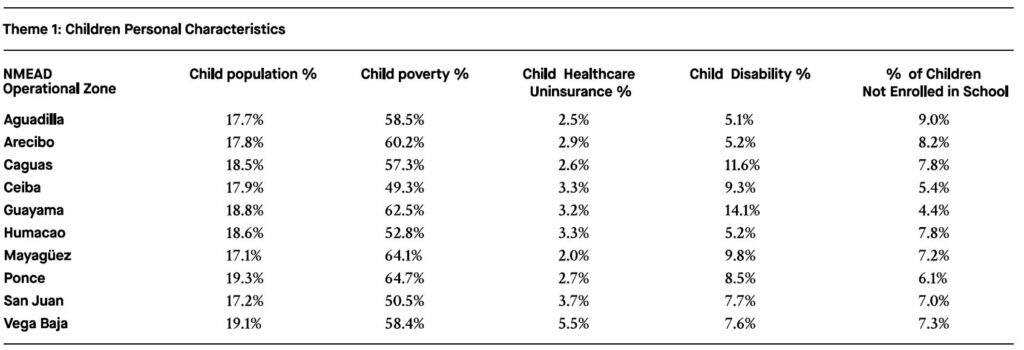
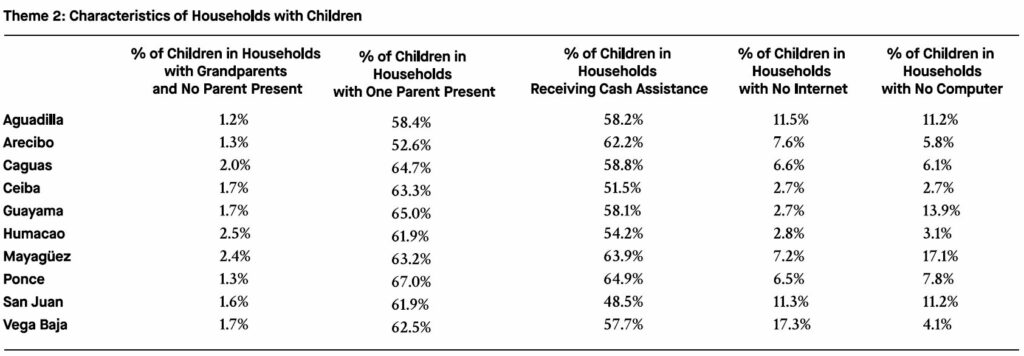
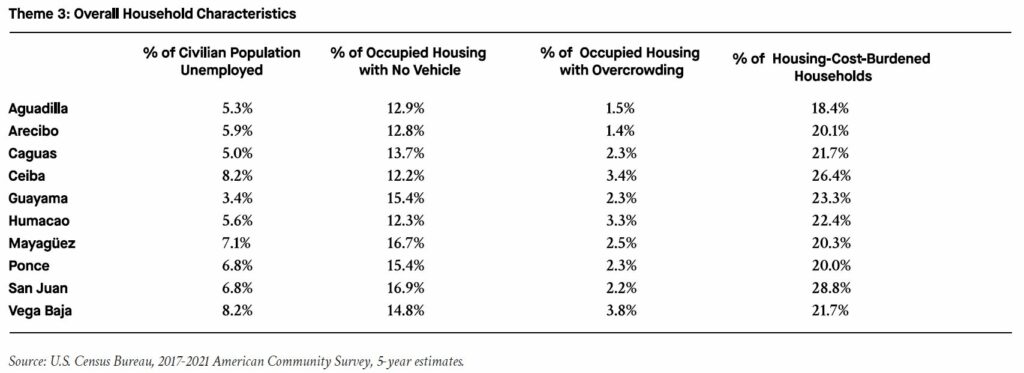
Table 1. Socioeconomic Characteristics by NMEAD Operational Zone, 2021
Source: U.S. Census Bureau, 2017-2021 American Community Survey, 5-year estimates.
Table 1 shows the socioeconomic variables of the children-age population used to create the CVI aggregated for each of the NMEAD Operational Zones. In 2021, the poverty rate for children between Operational Zones was highest in the Ponce Operational Zone (64.7%), followed by Mayagüez (64.1%), Guayama (62.5%), Arecibo (60.2%), Aguadilla (58.5%), Vega Baja (58.4%), and Caguas (57.2%), all of which were higher than the overall state level child poverty rate (56.3%). Child disability percentages were the highest in the Guayama Operational Zone (14.1%), followed by 11.6% in the Caguas Operational Zone, 9.8% in Mayagüez, 9.3% in Ceiba, 8.5% in Ponce, and 7.7% in the San Juan Operational Zone. These Zones also experienced earthquake disasters in 2020, specifically southwest region zones, and flooding as a result of the major hurricanes. As shown in Table 1, the Vega Baja Operational Zone (5.5%) had among the highest child health uninsurance percentages compared to other regions. This Operational Zone includes the Municipios of Vega Baja, Vega Alta, Corozal, Orocovis, Ciales, Morovis, Manatí, and Florida. Health uninsurance percentages for children under 19 in Manatí (10.8%) and Vega Baja (9.2%) were over two times higher than the state average (3.3%), while children residing in Morovis (2.9%), Vega Alta (2.7%), Orocovis (2.6%), Florida (1.1%), and Ciales (1.0%) had lower health uninsurance percentages. In our study, we found that the Operational Zones of Aguadilla (9.0%), Arecibo (8.2%), Caguas (7.8%), Humacao (7.8%), and Vega Baja (7.3%) had the highest percentage of children who were not enrolled in school in 2021. Of the Municipios that comprise the Aguadilla Operational Zone, which had the highest percentage of children between the ages of 3 and 17 not enrolled in school, Rincon (12.8%) had the highest percentage of school unenrollment, followed by Añasco (10.3%), Isabela (10.2%), San Sebastián (9.4%), Aguada (9.1%), and Moca (8.7%), while Aguadilla (6.6%) had the lowest percentage of unenrolled children in school.
In 2021, the percentage of children living in a single parent household for all of Puerto Rico was 62%. At the NMEAD Operational Zone scale, the percentage of children living in single parent households was highest in the Ponce Operational Zone, with 67% of children living in single parent households, followed Guayama (65%), Caguas (64.7%), Ceiba (63.3%), Mayagüez (63.2%), and Vega Baja (62.5%). Lower rates of children living in single parent households were seen in the San Juan Operational Zone (61.9%), Humacao (61.9%), Aguadilla (58.4%), and Arecibo (52.6%). Rates of children under 18 years old living with a grandparent with no parents present were higher in the Humacao (2.5%), Mayagüez (2.4%), and Caguas (2.0%) NMEAD Operational Zones.
Children living in households receiving some type of government assistance (Social Security Income, Cash Public Assistance, or SNAP) are also vulnerable when a disaster hits their communities. The rate of Children living in households receiving government assistance was the highest in the NMEAD Operational Zone of Ponce (64.9%), followed by Mayagüez (63.9%), Arecibo (62.2%), Caguas (58.8%), Aguadilla (58.2%), Guayama (58.1%), while this was lower in Vega Baja (57.7%), Humacao (54.2%), Ceiba (51.5%), and San Juan (48.5%). The rates of occupied housing with no internet access was highest in the Vega Baja NMEAD Operational Zone, with 17.3%, followed by 11.5% in Aguadilla, 11.3% in San Juan, 7.6% in Arecibo, 7.2% in Mayagüez, 6.6% in Caguas, 6.5% in Ponce, 2.8% in Humacao, and 2.7% in both Guayama and Ceiba. The rate of occupied housing with no computer in the household was highest in Mayagüez, with 17.1%, followed by 13.9% in Guayama, 11.2% in both Aguadilla and San Juan, 7.8% in Ponce, 6.1% in Caguas, 5.8% in Arecibo, 4.1% in Vega Baja, 3.1% in Humacao, and 2.7% in Ceiba.
The percent of the civilian population that is unemployed was highest in both Vega Baja and Ceiba, with 8.2%, followed by 7.1% in Mayagüez, 6.8% in San Juan, and 6.8% in Ponce. At the state level, the percent of unemployed civilians was 6.2%, and the following regions had lower rates: 5.9% in Arecibo, 5.6% in Humacao, 5.3% in Aguadilla, 5% in Caguas, and 3.4% in Guayama. Children living in cost-burdened households, where their caregivers are spending 30% or of their income towards rent or mortgage, was highest in the San Juan region, with 28.8%, followed by Ceiba (26.4%), Guayama (23.3%), and Humacao (22.4%). Additionally, overcrowding in the household was highest in Vega Baja (3.8%), followed by Ceiba (3.4%),, and Humacao (3.3%). Access to a vehicle is also important, as a means of transportation to prepare or to move to shelters or family and/or friends during pre- and post-disaster. No vehicle present was highest in San Juan 16.9%, followed by 16.7% in Mayagüez, and 15.4% in both Ponce and Guayama.
Table 2 contains the mean CVI for each NMEAD Operational Zone, computed at Municipio, Barrio, and Census Tract levels. When measured at Municipio level, Municipios in the Vega Baja Operational Zone have the highest CVI mean and Municipios in the Aguadilla Operational Zone have the lowest mean. When measured at Barrio level, Barrios in the San Juan Operational Zone have the highest mean CVI and Barrios in the Aguadilla Operational Zone, the lowest. Finally, when measured at Census Tract level, we see that tracts in the Vega Baja Operational Zone have the highest mean CVI and tracts in the Humacao Operational Zone have the lowest mean CVI.
Table 2. Mean CVI by NMEAD Operational Zones
| NMEAD Operational Zone | Mean CVI by Municipio | Mean CVI by Barrio | Mean CVI by Census Tract |
| Aguadilla | 0.263 | 0.410 | 0.430 |
| Arecibo | 0.347 | 0.446 | 0.461 |
| Caguas | 0.619 | 0.547 | 0.536 |
| Ceiba | 0.409 | 0.523 | 0.456 |
| Guayama | 0.596 | 0.475 | 0.533 |
| Humacao | 0.465 | 0.465 | 0.427 |
| Mayagüez | 0.533 | 0.494 | 0.530 |
| Ponce | 0.638 | 0.510 | 0.557 |
| San Juan | 0.428 | 0.612 | 0.491 |
| Vega Baja | 0.723 | 0.594 | 0.631 |
We assessed statistical evidence to state, for example, that at Municipio level, the Vega Baja Operational Zone has a statistically significantly greater mean CVI than the rest of the NMEAD Operational Zones in Puerto Rico. One-sided pairwise statistical hypothesis tests were performed to assess if a NMEAD Operational Zone’s CVIs was significantly higher or lower than the rest of the Operational Zones’ CVIs combined, the results of which are shown in Table 3.
Table 3. Statistical analysis results by NMEAD Operational Zones
| NMEAD Operational Zones | ||
| Geographic Level | Lower mean CVI | Higher mean CVI |
| Municipios | Aguadilla | Vega Baja |
| Barrios | Aguadilla, Arecibo | San Juan, Vega Baja |
| Census Tracts | Aguadilla, Arecibo, Ceiba | Ponce, Vega Baja |
We found that, when measuring relative child vulnerability at Municipio level, municipios in NMEAD’s Vega Baja Operational Zone have statistically significantly higher CVIs than municipios elsewhere, whereas municipios in the Aguadilla Operational Zone have lower relative child vulnerability than municipios elsewhere. When measuring CVI at Barrio level, barrios in the San Juan and Vega Baja Zones have higher CVIs than Barrios elsewhere, whereas Barrios in the Aguadilla and Arecibo Operational Zones have lower CVIs than Barrios elsewhere. When measured at Census Tract level, we find that Census Tracts in the Ponce and Vega Baja Operational Zones have higher CVIs than Tracts elsewhere in the archipelago, and that Census Tracts in the Aguadilla, Ceiba, and Humacao Zones have lower CVIs than Census Tracts elsewhere.
The Vega Baja Operational Zone, which includes the Municipios of Vega Baja, Vega Alta, Corozal, Orocovis, Ciales, Morovis, Manatí, and Florida, consistently tested as having a statistically significant greater mean CVI than the rest of the Operational Zones in the archipelago. On the other hand, the Aguadilla Operational Zone (containing Aguadilla, Isabela, Moca, Aguada, San Sebastián, Añasco, and Rincón) consistently tested as having a statistically significant smaller mean CVI than the rest of the Zones in the archipelago. According to these results then, children living in NMEAD’s Vega Baja Operational Zone collectively experience greater relative vulnerability than children living elsewhere.
Conclusion
Social vulnerability indexes (SVIs) are instruments designed to enhance government agencies and local communities’ resilience to hazardous events. In Puerto Rico, where more than 50% of children live in poverty, tools like the Child Vulnerability Index (CVI) can be leveraged to improve the living conditions of children and improve resilience of vulnerable communities. The CVI is an adaptation of the CDC SVI for all Municipios, Barrios, and Census Tracts that measures the relative vulnerability of children in Puerto Rico. The CVI is a two-pronged tool consisting of an ESRI Enterprise Dashboard and open source Python code that enables users to explore the landscape of child vulnerability in Puerto Rico as well as perform broader bespoke analysis.
Our analysis of the CVI shows that Municipios in the Central and South regions of the archipelago had higher levels of child vulnerability than Municipios in other regions. At lower level geographies, our analysis showcases the ubiquitous and unevenly distributed nature of child vulnerability in Puerto Rico: all Municipios except Culebra had at least one Barrio with CVI greater than or equal to 0.5, and 59 out of the 78 Municipios in the archipelago had Barrios with CVIs in all quartiles. Moreover, we demonstrated how the tool can be used to conduct custom analyses for government agencies such as the Negociado de Manejo de Emergencias y Administración de Desastres (NMEAD), which has divided the Municipios in Puerto Rico into ten Operational Zones tasked with assisting in emergency preparedness and response. For instance, statistical analysis of the CVI showed that Municipios, Barrios, and Census tracts in the Vega Baja Operational Zone have statistically significantly higher CVIs than elsewhere, an actionable insight for the Bureau to consider as they prepare for risk mitigation and disaster response.
SVIs are used by disaster managers and researchers to identify the locations of vulnerable populations with hopes of reducing vulnerabilities and inequalities associated with disasters. Researchers have also noted several limitations to the use of SVIs for disaster management and response. Some of the limits or critiques associated with SVIs are the absence of key sociodemographic characteristics associated with disaster vulnerability, such as racial minority status, disability, and gender. To this end, the CVI might be limited in its capacity to measure child vulnerability in Puerto Rico by not including measures of gender and race. Other measures not traditionally included in SVIs are those that account for the physical and built environment. Although the CVI does include measures of infrastructures, such as internet access and presence of vehicles in the household, other metrics such as flooding or distance to key infrastructure are not accounted for. As previously mentioned, SVIs are generally created by aggregating distinct social factors derived from national surveys or other publicly accessible data, such as the U.S. Census Bureau American Community Survey. These approaches have been debated for not including survey errors into their estimates, which are important for interpreting results, particularly in small areas. Our use of the 2017-2021 ACS 5-year estimates for the CVI without including survey errors might hinder the index’s capacity to measure vulnerability of children. The use of the 2021 ACS 5-year estimates is also limiting in that it includes data for 2020 that might be skewed because of interruptions in the data collection due to the COVID-19 pandemic. Use of ACS data, which considers children as those under 18 years of age, is also limited in the context of Puerto Rico, where the “Children’s Bill of Rights” defines children as those under 21 years of age. Fully incorporating these children into the CVI requires expanding the data sources. Furthermore, data from other sources such as other federal or Commonwealth agencies, or even ACS microdata, could elucidate child vulnerability in greater detail. Future iterations of the Child Vulnerability Index could include additional variables, such as the educational attainment of householders in households where children live, the geographic isolation of their community, and the food insecurity children are subject to, in order to understand child vulnerability in more depth.
Notwithstanding these limitations, the development of the Child Vulnerability Index is a step towards understanding and quantifying the child vulnerability landscape in Puerto Rico. Those who utilize the CVI will be able to identify and aid communities that are in need of attention and support, so as to safeguard the well-being of Puerto Rican children in the archipelago before, during, and after natural hazards occur.
Acknowledgements
We would like to thank Carlos Vargas-Ramos, Yerís Mayol-García, Fernando A. Tormos-Aponte, Fernando I. Rivera, Energy López Navarrete, and Alison Chopel for reviewing our work and providing feedback.
Authors
- Jennifer Hinojosa
- Laura Colón Meléndez
- Jorge R. Soldevila Irizarry
- Damayra I Figueroa-Lazu