Redistricting Threats to New York’s Hispanic Congressional Representation
Sections
Introduction
County-Level Changes
Congressional District-Level Changes
The Independent Redistricting Commission Plans
Appendices
Notes
Proposed redistricting maps threaten Hispanic congressional representation by eliminating a congressional district currently represented by a Hispanic member of the House of Representatives and diluting Latino voting power
Introduction
NEW YORK, November 1, 2021 — The Center for Puerto Rican Studies (CENTRO) at Hunter College, CUNY has issued a revealing report, “Redistricting Threats to New York’s Hispanic Congressional Representation,” analyzing the New York Independent Redistricting Commission’s draft plans for redistricting and its impact on Hispanic representation.
The Independent Redistricting Commission has released two versions of congressional maps: one identified with “Names” and another labeled “Letters”. While not final, some of the proposed maps threaten Hispanic congressional representation by eliminating one congressional district currently held by a Hispanic member of the House of Representatives, by diluting Hispanic population in several Hispanic majority districts, and by reducing the likelihood of continuing Hispanic representation in neighborhoods that have just achieved Hispanic representation.
Paradoxically, the attempts to dilute Hispanic political representation come on the heels of large Hispanic population increases across the state that have prevented New York State from losing even more congressional seats in the apportionment process.
On April 26, 2021, the U.S. Census Bureau delivered to the President of the United States results from the 2020 decennial census to be used for apportionment. Simultaneously, the Census Bureau presented apportionment results showing the state of New York’s delegation in the U.S. House of Representatives will decrease to 27 to 26 representatives for the next ten years beginning with the 118th Congress (2023-2025).ii
Apportionment is the process by which the 435 seats in the U.S. House of Representatives are divided among the fifty states of the union. This is a constitutionally-mandated task based on the decennial enumeration the U.S. Census Bureau conducts.iii The U.S. constitution guarantees each state one representative in the House of Representatives; the remaining 385 seats are then apportioned (that is, divided) based on each state’s total population.iv
This decrease of one representative in the state’s congressional delegation was not necessarily unexpected given the relatively slower population increase New York experienced between 2010 and 2020. Between decennial censuses, the state’s population grew by 4.1%, nearly half as fast as the rate of growth of the country’s population as a whole, which increased by 7.1%.v New York’s rate of growth earned it thirty-first place as the state with the largest population growth (see Table 1). Utah, Idaho, Texas, North Dakota, Nevada, Colorado, and Washington were the states with the highest population increases, with rates of growth that were more than double the rate of growth of the country’s population.
New York’s relatively tepid population growth resulted in the loss of congressional representation as congressional seats are redistributed nationally in light of changes in population during the decade.vi New York State fell 89 persons short of the threshold needed to retain a 27th member of the House of Representatives.vii As a result of losing one seat in the House of Representatives, New York’s congressional delegation will be the fourth largest in the country after California, Texas, and Florida.
Congressional districts must be drawn with an equal number of residents within each district with only a one-to-two-person deviation. This process is called redistricting and it is based on the state’s 2020 resident population of 20,201,249 persons. All 26 Congressional districts must have approximately 776,971 persons.
Table 1. Population Change by State, 2010 – 2020
You may sort the table by clicking a column name.
County-Level Changes
Just as the country’s population is not distributed evenly, New York’s population is not distributed evenly throughout the state either. As in many previous decades, the bulk of the state’s population was located downstate, in and around the counties that encompass New York City and its surrounding environment. In 2020, Kings, Queens, New York, Suffolk, Bronx, Nassau and Westchester counties contained more than 60% of the state’s population (see Table 2). All of these counties had more than one million residents, with Kings and Queens exceeding more than two million people each.
Table 2. Rate of Growth of the Population by Ethnicity and Race at the County Level, 2010-2020
You may sort the table by clicking a column name.
With the addition of Erie and Monroe counties, these counties with large urban centers anchoring them contained more than two-thirds of the state’s population. A review of population changes at the county level between 2010 and 2020 shows that 22 of the state’s 62 counties increased in population, with rates of growth ranging from less than one percent to more than nine percent.
Of the top ten counties in population growth were all five counties in New York City (i.e., Kings, Queens, New York, Bronx, and Richmond), counties immediately to New York City’s north and west (i.e., Orange, Rockland, and Westchester), and two counties upstate (i.e., Saratoga and Hamilton) (see Figure 1). Of the remaining counties that grew in population, but at a slower rate of growth, were those containing other cities in the state (e.g., Erie, Albany, and Monroe) as well as some counties adjacent to those with large urban centers (e.g., Ontario, Schenectady, Rensselaer, Nassau, and Suffolk), and some rural upstate counties (e.g., Tompkins, Onondaga, and Jefferson).
Figure 1. Total Population Change by County, 2010-2020
Despite the growth in population in these 22 counties, more New York counties lost population rather than gained it. Of the state’s 62 counties, 39 decreased in population. These 39 counties were located upstate, with population losses ranging between less than one-percent and nine percent. The largest drops were in counties located between the Catskills and the Finger Lakes region (e.g., Delaware, Madison, Chenango, and Otsego), between the Adirondacks and Lake Ontario region (e.g., Herkimer, Oneida, and Lewis), and the Southern Tier region (e.g., Steuben, Chautauqua, and Tioga). (Warren County’s population remained virtually unchanged.)
Variations in growth are also evident for the different ethnic and racial group that make up the state’s population. Population losses across the state and its counties were driven mostly by the decrease in the largest group in the state—non-Hispanic whites—and to a lesser extent by the non-Hispanic black population. The non-Hispanic white population represented 52.5% of the state’s population in 2020; but it declined by 6.2% from 2010 (see Table 3). Non-Hispanic blacks represented 13.7% of the state’s population, and declined by 0.9%. On the other hand, New York’s population grew because of its non-Hispanic Asian, Native Hawaiian, and multiracial populations (as well as Hispanics), which grew by 36.3%, 14.6%, 121.1%, and 15.5%, respectively. However, it was particularly the growth of the Hispanic population that drove the state’s population growth by more than 531,000 persons. In comparison, the non-Hispanic population increased by 1.8% between 2010 and 2020 (or 292,000 persons).
Table 3. New York Resident Population Change by Ethnicity and Race, 2010-2020
You may sort the table by clicking a column name.
At the county-level, there are also notable variations in the changes in population between 2010 and 2020. Whereas 39 counties lost population overall during this period, the non-Hispanic population decreased in most, declining in 48 counties (see Table 2). Driving this decline across counties was the non-Hispanic white population, which declined in 57 counties (see Figure 2) followed by the non-Hispanic black population, which declined in 27 counties. In contrast, non-Hispanic Asians and Latinos each only lost population in 11 counties and 3 counties, respectively (for Hispanics, see Figure 3). The proportion of growth of these two population groups statewide was in the double digits. At the county level, Hispanic population growth ranged between 4% and 96%; for non-Hispanic Asians, their growth ranged between 1.4% and 147%.
Figure 2. Non-Hispanic White Population Change by County, 2010-2020
Figure 3. Hispanic Population Change by County, 2010-2020
As a result of population changes between 2010 and 2020, we observe there were 8 counties in the state with Hispanic shares of their population that exceeded the statewide proportion of Hispanics (19.5%). These counties were located in either New York City or in adjacent counties. The most Hispanic county in the state was the Bronx with 54.76% of its residents identifying as being of Hispanic, Latino, or Spanish origin. Between decades, the Bronx grew even more Hispanic as the proportion of people identifying as Hispanic grew from 53.5%. No other county in the state approached this level of Hispanic residents in their midst. Following the Bronx were counties in which the Hispanic population represented more than one-quarter (i.e., Queens and Westchester), or about one-fifth (i.e., New York, Orange, Suffolk, Rockland, and Richmond). In suburban and exurban counties of New York City, Hispanic population growth in excess of 30% drove the increase in the Hispanic share of the population coupled with the decline in the non-Hispanic white population. Other suburban (i.e, Nassau) and exurban counties (i.e., Putnam and Sullivan) in the New York City environs had Hispanic shares of the population close to the statewide average.
Congressional District-Level Changes
Similar changes in population are also evident at the congressional district level. Members of the 113th Congress of the United States (2013-2015), the first Congress elected after the previous apportionment and redistricting process following the 2010 decennial census, represented approximately 717,700 constituents at the start of the first session of their term. In contrast, as a result of population changes between 2010 and 2020 (i.e, births, deaths, and people moving in and out of districts), representatives of 116th Congress (2019-2020) from New York represented between 693,500 (23rd district) and 811,600 (12th district), a difference in excess of 17% (see Table 4).viii Population change at the congressional district level ranged between a gain of 13% in the intervening years (12th district) and a loss of 3% (23rd district). The districts in New York for the upcoming 117th Congress (2023-2024) will include approximately 776,971 persons. This means that some districts will need to shrink in population and other districts will need to increase in population for all 26 congressional districts allocated to New York to have the same number of persons within them. However, because New York has lost one congressional seat, boundaries will have to be redrawn significantly to accommodate the changes in representation and population.
Table 4. Population Change by Congressional District, 2010-2020
You may sort the table by clicking a column name.
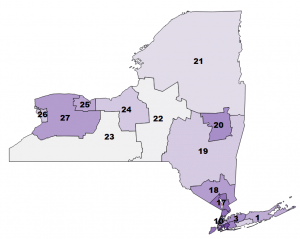
Of the 27 congressional districts in New York, 22 saw their population increaseix while 5 lost population.x All the districts that saw population decline were located upstate (i.e., 23rd, 22nd, 19th, 21st, and 24th) (see Figure 4). The districts with the fastest population growth were all located within New York City or adjacent to it (i.e., 12th, 8th, 10th, 5th, and 16th).
Figure 4. Total Population Change by Congressional District, 2010-2020
As with changes at the county-level, the most notable changes between 2010 and 2020 in terms of race and ethnicity were driven by the changes among non-Hispanics, specifically non-Hispanic whites, and Hispanics. The non-Hispanic white population decreased in 21 congressional districts, and it increased in six (see Figure 5). The Hispanic population grew in 25 districts across the state and decreased in only 2 districts (see Figure 6). Non-Hispanic Asians increased in all 27 districts of the state. Non-Hispanic blacks, lost population in 10 districts but increased in 17 districts.
Figure 5. Non-Hispanic White Population Change by Congressional District, 2010-2020
Figure 6. Hispanic Population Change by Congressional District, 2010-2020
Since congressional districts need to be drawn to include 776,971 persons each and the number of districts is reduced to 26 from 27, district boundaries are likely to change significantly. This means that communities that were represented by one representative may be represented by a different one come the next Congress. One might expect that given the fact that most of the population growth across the state has taken place downstate, and specifically New York City, then New York City will not be in danger of losing congressional representation. Similarly, given that more than any ethnic group, Hispanics have contributed to the growth of New York State’s population, then one would expect that Hispanic congressional representatives should be safe from losing their seats in the redistricting process. But this is not guaranteed. (Winning elections is another matter.)
Presently, there are 13 congressional districts representing New York City fully (i.e., 5th, 6th 7th, 8th, 9th, 10th, 11th, 12th, 13th, 14th, and 15th) or partially (i.e., 3rd and 16th). Suffolk and Nassau counties are represented largely by four districts (1st, 2nd, 3rd, and 4th). Westchester County is partly represented by the 16th, 17th (which also contains Rockland County), and 18th districts. The 18th congressional district contains the bulk of Putnam and Orange counties, and parts of Dutchess County. The remaining 50 counties in the state are represented in the remaining nine congressional districts.
The Independent Redistricting Commission Plans
The job of redrawing the boundaries of the new districts at the congressional level, but also at the level of the State Senate and the State Assembly, falls on the New York Independent Redistricting Commission. The Independent Redistricting Commission is a governmental body adopted by voters through a referendum proposal in 2014. The Commission is made up of 10 members: eight appointed by the majority and minority leaders of the New York State Senate and Assembly, and two appointed on a non-partisan basis by those selected 8 members. All 10 commissioners are tasked with drawing electoral districts across the state after input from the public in official hearings. It must submit redistricting plans to the state legislature by January 1, 2022, but in any event no later than January 15, 2022.
The Independent Redistricting Commission has already released two versions of maps.xi Press accounts indicate the Commission was not able to arrive at a consensus of draft plans, which is why it released two sets of maps for public comment. The Commission has indicated that in “the event that the commission is unable to obtain seven votes to approve a redistricting plan on or before January first in the year ending in two or as soon as practicable thereafter, the commission shall submit to the legislature that redistricting plan and implementing legislation that garnered the highest number of votes in support of its approval by the commission with a record of the votes taken.”xii The Commission indicates further that if it “does not vote on any redistricting plan by the date required for submission, the commission shall submit to the legislature all plans in its possession, both completed and in draft form, and the data upon which the plans are based.”
A cursory review of both sets of congressional maps released by the commission shows implications for Hispanic constituents and Hispanic legislators. One set of district maps, denoted by the Commission using “names,” would reduce the political influence of Hispanic (and non-Hispanic black) constituents by eliminating district 14th altogether, and by limiting the number of districts representing Bronx county. Presently, the Bronx is represented by 4 representatives whose congressional districts include at least portions of the county (e.g., 13th, 14th, 15th and 16th). The “names” plan would reduce this representation by one representative, leaving only 3 districts representing the county (i.e., southbronx, northbronx, and yonkers). Moreover, those current representatives are either Hispanic (i.e., Adriano Espaillat, Ritchie Torres and Alexandria Ocasio-Cortez) or non-Hispanic black (i.e., Jamaal Bowman). By removing a district representing the county, the Bronx will also lose not only political representation overall, but specifically political representation by underrepresented minority representatives, even as the Bronx is the only Hispanic-majority county in the state, and it ranked 7th in population growth between 2010 and 2020. While the redistricting process should not be designed for representatives to choose their constituents, by drawing the three “names” districts (i.e., southbronx, northbronx, and yonkers) in such a manner, the Independent Redistricting Commission is in fact contriving to remove chosen representatives of voters in Bronx County.
This unjustified proposal by the Commission raises questions about its motivation and intent when a county, home to minority groups who have been historically politically underrepresented, and whose population has increased disproportionately, sees its political representation decimated while parts of the state that have suffered staggering population losses maintain their political representation.
The “names” plan would also leave historically Hispanic and non-Hispanic black neighborhoods bereft of political representation of their preference and choosing, diluting the voting impact of their residents. For instance, the present 13th congressional district would be virtually drawn out of existence by the proposed “northmhtn” district. This proposed district would combine the 12th and parts of the 10th districts, and would absorb East Harlem, Central Harlem, West Harlem, and portions of Washington Heights. In 2020, the 13th district had a population that was 52.7% Hispanic. In contrast, 13.6% of the 12th district was Hispanic, while the 10th district was 13.1% Hispanic. The “names” plan would set the Hispanic population in the resulting “northmhtn” and “southmnhtn” districts at 25.3% and 13.6%, respectively. The 14th congressional district would disappear altogether by combining Bronx portions of it with the bulk of district 15th and combining Queens portions of it with portions of districts 7th and 12th. The net effect is that this “names” plan contrives to eliminate a district of an existing Hispanic legislator in portions of the state that have exceeded population growth above statewide levels. Queens ranks third in population growth between censuses, growing 7.8%. (The “names” plan also dilutes the representation of non-Hispanic black voters in the process of redrawing congressional districts.)
Bronx, Kings, and New York counties have been under the scrutiny of the U.S. Justice Department until recently for practices that diluted and undermined the voting rights of their minority citizens. This proposed “names” plan suggests interests in the state are attempting to reassert a discriminatory tradition historically present in the state’s governing institutions.
Another set of congressional district maps proposed by the Commission, the “letters” plan, may not be as egregious in diluting Hispanic voters’ influence and limiting the opportunity of electing representatives of their preference. Nevertheless, it still presents some challenges to Hispanic residents of the state and Hispanic legislators. The “letters” proposal retains large features of the present configuration of congressional districts that provide Hispanic voters with ample opportunity to elect representatives of their preference, and it largely retains district compositions that include neighborhoods historically contained in those congressional districts. Counties like the Bronx are able to retain a congressional representation of four members of the House of Representatives (i.e., proposed districts “I”, “R”, “Q” and “S”), while the Upper Manhattan proposed district (i.e., “Q”) includes neighborhoods traditionally included in it (e.g., East Harlem, Central Harlem, Manhattanville, and West Harlem). Yet, the extension of the boundaries for proposed district “R” into areas of the northwest Bronx not historically included in such a district may challenge the current Hispanic representative.
These proposed maps, both the set denoted by “letters” and the set denoted by “names,” have not been approved by the Independent Redistricting Commission. The Commission continues its work of receiving input from the public regarding the proposed maps and continues to schedule hearings for that purpose. The public, therefore, continues to have an opportunity to participate in the process by providing testimony and by submitting plans of its own for the Commission’s consideration. However, the process is approaching its final stages as the boundaries for congressional, State Senate and State Assembly districts need to be in place for the election cycle in 2022.
Appendices
Appendix A. Proportions of the Congressional Districts’ Population by Ethnicity and Race, 2020
You may sort the Appendix by clicking a column name.
Appendix B. Proportions of the Counties’ Population by Ethnicity and Race, 2020
You may sort the Appendix by clicking a column name.