Redistricting NYC: Demographic Change and The Hispanic Community
Sections
Demographic Dynamics in New York City
Borough-level population growth
Borough-level population shares
Borough-level population changes
A diverse Hispanic population
Changes in the Hispanic population
Population at the council district level
Population change at the council district level
The Hispanic population by national origin at the council district level
Change in the Hispanic population by national origin at the council district level
Distribution of languages spoken at home
Income distribution
On July 15, 2022, the New York City Districting Commission released a preliminary plan for council districts after holding meetings since March 29, and public hearings since May 26. Presently, the Districting Commission has drawn 29 majority districts and 22 plurality districts. Of the 51 districts preliminarily drawn, non-Hispanic whites represent a majority in 11 districts and the single largest population group (i.e., plurality) in another nine districts. Hispanics represented the majority population in 10 districts and the plurality in five more. Blacks are the majority in six preliminary districts and the plurality in five other districts. Asians are the majority population in two districts and the plurality in another three districts. Overall, this outcome is surprising when compared to the composition of current council districts in light of the 2020 decennial census. The difference in the district’s population distribution in the preliminary plan seems to give an advantage to the non-Hispanic white population, evident in how those plans affect plurality districts.
In this report, we provide a portrait of demographic changes in New York City between 2010 and 2020, examining overall population dynamics as well as looking more closely at the ethnoracial composition of the city and its constituent boroughs and council districts. We rely on decennial census data for 2010 and 2020 provided by the U.S. Census Bureau in their Redistricting Files. We also examine changes in the distribution of language use, particularly among New Yorkers who do not speak English well or at all since this may be an impediment to their effective participation in the political process, including registering to vote and voting. Furthermore, we provide information on the geographical distribution of income as this is another important variable for participation in the political process. We also analyze the demographic changes of the different national origin groups that make up the Hispanic population in New York City; a population of particular interest for us. These additional analyses are produced from survey data also derived from the U.S. Census Bureau (i.e., the American Community Survey). We conclude by assessing the council districts preliminarily drawn by the New York City Districting Commission in light of the ensuing descriptive analyses.
Demographic Dynamics in New York City
The Hispanic population in New York City continued to grow between 2010 and 2020. There were 2,490,350 persons in the city who identified as Hispanic, Latino or some other Spanish origin in 2020 (see Table 1), representing 28.3% of the 8,804,190 persons living in New York (see Table 2). This 2.4 million Hispanics represented a growth of 6.6% relative to the 2,336,076 Hispanics who lived in New York City in 2010 (see Table 3). This rate of growth was slower than the rate of growth of the city’s population as a whole, which stood at 7.7%.
Hispanics have contributed more than 154,000 people to the increase in the city’s population between 2010 and 2020. The biggest driver of the city’s population growth has come from persons who identified as Asian, which added more than 345,000 persons during the same period; a rate of growth of more than 33% (see Table 3). New Yorkers who identified by some other racial category from those offered by the U.S. Census Bureau, or those who identified with more than one racial category grew at a much faster rate, more than doubling their numbers from 2010. Persons who identified with more than one racial group increased by more than 151,000 while those who used another label to identify racially grew by more than 63,000 people. In contrast to population groups that grew between 2010 and 2020, non-Hispanic whites and non-Hispanic blacks declined in population: There were 3,000 fewer non-Hispanic whites—a decline of 0.1%—and 84,000 fewer non-Hispanic blacks—a decline of 4.5%.
As a result of these population changes, Hispanics represented the second most numerous ethnic group in the city after non-Hispanic whites, who, despite a small decline, still accounted for 31% of the overall population (see Table 2). Non-Hispanic blacks were the third largest group with a population share of 20%. The population of Asian origin accounted for nearly 16% of the city followed by those of multiple racial backgrounds (3%), those of some other racial background (1%) and those of Native heritage (less than 1%), whether American Indian, Alaska Native, Native Hawai’ian or other Pacific Islander.
This city’s population distribution, along with the rates of growth of its ethnic groups, resembles that of New York State overall. Driven by the rate of New York City’s growth (7.7%), the state population grew by 4.2%. Non-Hispanic whites were the largest ethnic group in the state—in fact, the majority—but they declined by 6% between 2010 and 2020. Hispanics were the second largest group, representing 19% of the state’s population and growing by more than 15%. Non-Hispanic blacks were the third largest group in the state (13%), but their numbers declined slightly (0.9%) between decades. Asians followed with 9.5% of the state’s population, a rate of growth of 36%. The multiracial population represented 3% of the state’s population while those who used another racial term were about 1% of the population overall; both these groups more than doubled their numbers between decades. Meanwhile, the Native heritage populations represented less than 1% of the overall population of the state.
Borough-level population growth
All New York City boroughs experienced population growth with Brooklyn and Queens experiencing the most growth. Brooklyn had 2,736,074 residents in 2020 and Queens was home to 2,405,464 persons. Their rates of population growth between decades were 9.2% and 7.8%, respectively, exceeding the city’s overall rate of growth. Manhattan, the Bronx and Staten Island also grew their populations (6.8%, 6.3% and 5.8%, respectively), but not to the same extent as Brooklyn and Queens. Nevertheless, the distribution of the city’s population by borough remained as it has over the past four decades: the Bronx, under 17%; Brooklyn, 31%; Manhattan, 19%; Queens, 27%; and Staten Island, under 6%.
Borough-level population shares
The Bronx is the most Hispanic borough in the city and the entire state, with more than 806,000 persons out of 1,472,600 identifying as Hispanic, Latino or of Spanish origin (see Table 1). They represented half the borough’s population (54.8%) (see Table 2). The Bronx is also the borough with the lowest percentage of non-Hispanic whites (8.9%). Non-Hispanic blacks made up 28.5% of the borough’s population while Asians represented 4.6%.
After the Bronx, Queens was the city’s borough with the second largest number of Hispanics—631,657 persons. They represented nearly 28% of the borough’s total population. Queens is also the borough with the second lowest proportion of non-Hispanic white residents in the city—22.8%—after the Bronx. On the other hand, Asians are the second largest broad ethnic grouping in the borough (27%). Queens is also the city’s borough in which Asians have the greatest share of the population. Non-Hispanic blacks were 16% of the borough’s population while those who indicated their race using a different term than offered by the Census Bureau were 2.3% of the population.
Hispanics represented 19% of Brooklyn’s population, the city’s borough in which Hispanics had the smallest share of the population. Non-Hispanic whites were 35% of the borough’s residents, non-Hispanic blacks were 27% and Asians were 14%. Brooklyn was also the city’s borough in which more people indicated their race by selecting more than one racial category (4%).
Hispanics were nearly a quarter (24%) of Manhattan’s 1,694,200 people, the second largest group in the borough after non-Hispanic whites (47%). Asians and non-Hispanic blacks represented 13% and 12% of the borough’s population, respectively.
Staten Island, the city smallest borough in terms of population, with 495,700 persons in 2020, is also the borough with the city’s largest share of non-Hispanic white residents—56%. Hispanics followed, representing about one-fifth of the population with Asians accounting for 12% and non-Hispanic whites accounting for 9% of the borough’s residents.
Borough-level population changes
As noted, Hispanics, Asians, persons of Native heritage and persons who identified with more than one racial category or with categories different from those offered by the Census Bureau all grew in population numbers citywide between 2010 and 2020. But their rate of change at borough-level was not uniform (see Table 3).
Asians were the only singularly defined panethnic group whose population grew in every borough, ranging from as low a rate of 24% (42,000 persons) in Manhattan to a high of 69% (24,056 persons) in Staten Island. In absolute numeric terms, Asians grew the most in Queens (148,249 persons) even when their rate of growth in that borough was 29%. For persons who selected more than one of the standard Census Bureau racial categories, their rate of growth citywide was 102%, doubling their number by 151,283 persons. Their rate of growth was greater in Brooklyn at 183% (73,160 persons) and lowest in Queens at 50% (28,000 persons). Also, among those who chose another racial category than those offered by the Census Bureau, their numbers more than doubled (110%) between 2010 and 2020, growing by 63,343 across the city. Those who chose “some other race” had the greatest rate of growth (209%) in Brooklyn, growing by 22,264 persons, and their lowest rate at 72% in Queens, where they nevertheless had the largest absolute growth (23,150 persons).
For other ethnoracial groups, the rate of growth at the borough level was more varied, with some groups growing or declining depending on the borough. As noted, Hispanics grew citywide at 6.6% between decades, growing at a greater rate in Staten Island (20%), or by 15,909 persons, but slightly declining in Manhattan (-0.2%) by 937 fewer persons. Nevertheless, the largest numerical growth of the Hispanics population occurred in the Bronx, where Hispanics added more than 65,000 persons, followed by Queens with an additional 54,111 persons.
Non-Hispanic blacks had the greatest population decline numerically and proportionally of any large ethnoracial group in the city (-4.5%) or by 84,404 fewer people. Non-Hispanic blacks declined in population in Brooklyn, Manhattan and Queens. The proportional decline was steeper in Brooklyn (-8.7%) or by 69,370 fewer people, followed by declines of 14,506 persons in Queens (-3.7%), and 5,748 persons in Manhattan (-2.8%). However, they increased in population in the Bronx and Staten Island, growing by 2,698 persons (or 0.6%) and 2,522 persons (or 5.7%), respectively.
Non-Hispanic whites declined in population by 3,048 persons citywide (or -0.1%). Their sharpest proportional decline took place in the Bronx with a 13.5% drop, or 20,143 fewer people between 2010 and 2020. However, their largest numerical decline took place in Queens, declining by 67,369 people even when their proportional decline was only 10.9%. Their 22,188-person decline in Staten Island represented a -7.4% change rate between decades. Yet, non-Hispanic whites increased by 75,121 persons (or 8.4%) in Brooklyn and by 31,801 persons (or 4.2%) in Manhattan.
A diverse Hispanic population
New York is an exceedingly varied city and so is its Hispanic population. Whereas nationwide the Hispanic population is predominantly, although not exclusively, of Mexican-origin (61%), in New York, Hispanics are mostly of Caribbean descent since 58% of the 2.4 million persons who identify as being Hispanic, Latino or of Spanish origin have roots or origins in the Dominican Republic, Puerto Rico or Cuba. (This population distribution is also evident in the state of New York, where 54% of Hispanics hail from the Caribbean.) Of these three groups, Dominicans are the most numerous Hispanic group in the city with 699,150 persons (or nearly 29%), followed very closely by Puerto Ricans with 669,490 persons (or about 28%) (see Table 4). The Cuban-origin population represents less than 2% of Hispanics in the city. In fact, the third most numerous Hispanic group is made up of the Mexican-origin population with 321,000 persons (or 13%). No other Hispanic national origin group exceeded 10% of the city’s Hispanic population, with Ecuadorians coming closest at 8%. Collectively, South Americans represented 16% of the city’s Hispanics (387,800 persons) and Central Americans represented 7% (176,500 persons).
At the borough level, we also observe that the three largest Hispanic groups citywide tend to be the three largest groups, although not always in the same order. Therefore, Dominicans (41%) were the largest Hispanic group in the Bronx followed by Puerto Ricans (33%) and Mexicans (10%). This was also the pattern in Manhattan with Dominicans representing 40%, Puerto Ricans 25% and Mexicans 11%. The pattern shifts for the remaining boroughs. In Brooklyn, Puerto Ricans (30%) were the most numerous Hispanic group, followed by Mexicans (20%) and then Dominicans (19%). In Queens, Puerto Ricans (17%), Ecuadorians (17%) and Dominicans (16%) had very similar shares of the borough’s Hispanic population with Mexicans (13%) and Colombians (11%) adding to the diversity of the group in the borough. In Staten Island, Puerto Ricans represented nearly half (49%) the Hispanic population in the borough followed by Mexicans (19%) and Dominicans (7%).
Changes in the Hispanic population
The most notable change between 2010 and 2020 has been the overall decline of the Puerto Rican population, which was much more pronounced in New York City (-12.5%), but also evident statewide (-2%) (see Table 5). There were 96,000 fewer Puerto Ricans in New York City in 2020 than in 2010 (765,500 persons). Puerto Ricans were not the only Hispanic group to decline in the city between decades. Cubans, Panamanians and Bolivians also declined, although some of these other national-origin groups had smaller population numbers to begin with.
Along with the decline of some Hispanic groups comes the increase of others. Proportionately, Spaniards (62%), Guatemalans (36%), Argentineans (32%), Venezuelans (28%) and Nicaraguans (26%) had some of the highest growth rates among Hispanics; however, their absolute numbers remain relatively low, ranging from 92,000 (e.g., Guatemalans) to 16,000 persons (e.g., Nicaraguans). The largest absolute increases in population were evident among Dominicans, with 127,000 additional persons; Mexicans with 29,000 additional persons; and Ecuadorans with 14,700 additional persons.
At the borough level, Puerto Ricans also saw their numbers decline, but not at the same rate or in every borough. Puerto Rican population decline was more pronounced in Brooklyn with a 22% decrease. It also declined by 15% in the Bronx and 11% in Manhattan. The decline was slight in Queens (-0.6%), but increased by 14% in Staten Island.
Dominicans grew in every borough with the largest increases in the Bronx (45%) and Staten Island (43%). But they increased at a lower rate in Queens (16%) and Brooklyn (9%) with the lowest rate in Manhattan (1%). The rate of growth of the Mexican population was fairly even (9%) in the Bronx, Brooklyn and Manhattan with Queens being slightly lower (8%). The rate of growth was much faster in Staten Island (28%). Collectively, the Central American population grew fastest in Staten Island (50%), Queens (20%) and the Bronx (15%) compared to Brooklyn or Manhattan (5%). South Americans also grew in every borough: 16% in Manhattan, 14% in the Bronx, 12% in Brooklyn, 3% in Queens and 1% in Staten Island.
Population at the council district level
New York City boroughs are political and administrative subdivisions of a consolidated New York City. In addition to the boroughs, the city is further subdivided administratively into community districts, school districts, sanitation districts, health districts, and police precincts, among others. Politically, New York City is divided into 51 council districts, with each district sending one representative to the New York City legislature—the City Council.
After the redistricting process that was conducted between 2012 and 2013, each council district contained approximately 160,296 persons. With the increase in population between 2010 and 2020, the New York City council districts will increase in population by 12,335 persons to 172,631 persons. In addition, the city’s population will also increase by the number of persons incarcerated whose last known address prior to incarceration was in New York City. As a result, the optimal population for every council district should be 172,882 persons. While nearly all districts in the city increased in population, they did not all increase by the same number of people. In order to preserve the principle of “one person, one vote” council districts will have to be reconfigured to have approximately the same number of residents. Below we offer a population profile of the New York City Council districts that will inform the redistricting process.
The Hispanic population was the majority ethnic group in nine of the city’s 51 council districts (i.e., Districts 21, 14, 10, 17, 15, 8, 16, 18 and 37), ranging between 52% and 74% of the district’s population (see Table 6). In addition, Hispanics were represented in another 10 districts (i.e., Districts 11, 13, 34, 25, 7, 38, 30, 32, 49, 26) in proportions greater than their citywide rate (28%), ranging between 29% and 45%. Of these above-average share districts, Hispanics were the plurality group in six (i.e., Districts 7, 11, 13, 32, 34 and 49). In contrast, non-Hispanic whites were the majority population in 11 council districts (i.e., Districts 2, 3, 4, 5, 6, 33, 39, 44, 48, 50 and 51), ranging in share of the population between 53% and 77%. Non-Hispanic whites were also represented above their citywide proportion (31%) in another 11 council districts. Non-Hispanic whites were the plurality in eight of these districts (i.e., Districts 22, 43, 30, 35, 1, 47, 29 and 19).
Non-Hispanic blacks were the majority population in seven council districts (i.e., Districts 41, 42, 12, 27, 31, 45 and 46), ranging in proportions from 54% to 70% of those district’s populations. Non-Hispanic blacks were also represented above their citywide population average (20%) in another 12 council districts of which they were the plurality group in four of these districts (i.e., Districts 36, 9, 40 and 28). The Asian population was the majority in one council district (i.e., District 20), in which they represented 72% of the population. They were also represented above their citywide proportion (16%) in another 14 council districts, and were the plurality in five of these districts (i.e., Districts 23, 25, 38, 24 and 26).
Population change at the council district level
Population change at the council district level ranged from an increase of 46,600 persons in Council District 33 to a decline of 7,700 persons in District 10. On average, the districts’ population increased by 12,335 persons between decades, doing so in 49 districts while declining in two (i.e., Districts 7 and 10). The city’s population grew at a rate of 7.7%, as we have noted, but population growth at the council district level ranged between 29% (i.e., District 33) and 20% (i.e., District 3) to declines of 2% (i.e., District 7) and 5% (i.e., District 10) (see Table 7). The population in 23 council districts grew at rates faster than the city’s overall population growth with the other 28 districts growing below that rate (or declining).
Figure 1. Total Population Change at the Council District Level (in percentage), 2010-2020
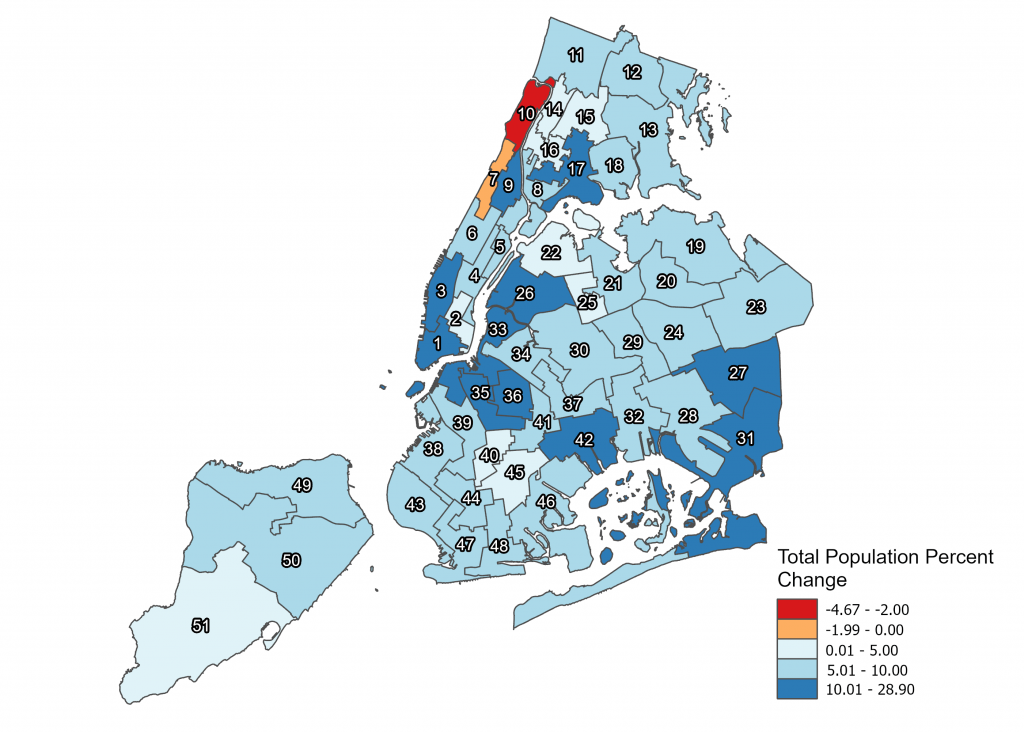
Source: U.S. Census Bureau, 2020 Census Redistricting Data (Public Law 94-171), Table P2
The Hispanic population grew in 40 council districts, remained virtually unchanged in two (i.e., Districts 40 and 2) and declined in nine (i.e., Districts 2, 39, 8, 22, 25, 37, 38, 7, 34 and 10). The rate of growth in these districts ranged between less than one percent and no more than 25%. In absolute terms, Hispanic growth ranged between 171 persons and 14,600 persons. Their rate of decline ranged between 4% and nearly 12%, or 1,200 persons and 13,600 persons. In terms of a pattern of growth, it varied depending on whether the growth was measured proportionately or in absolute numbers.
Figure 2. Total Hispanic Population Change at the Council District Level (in percentage), 2010-2020
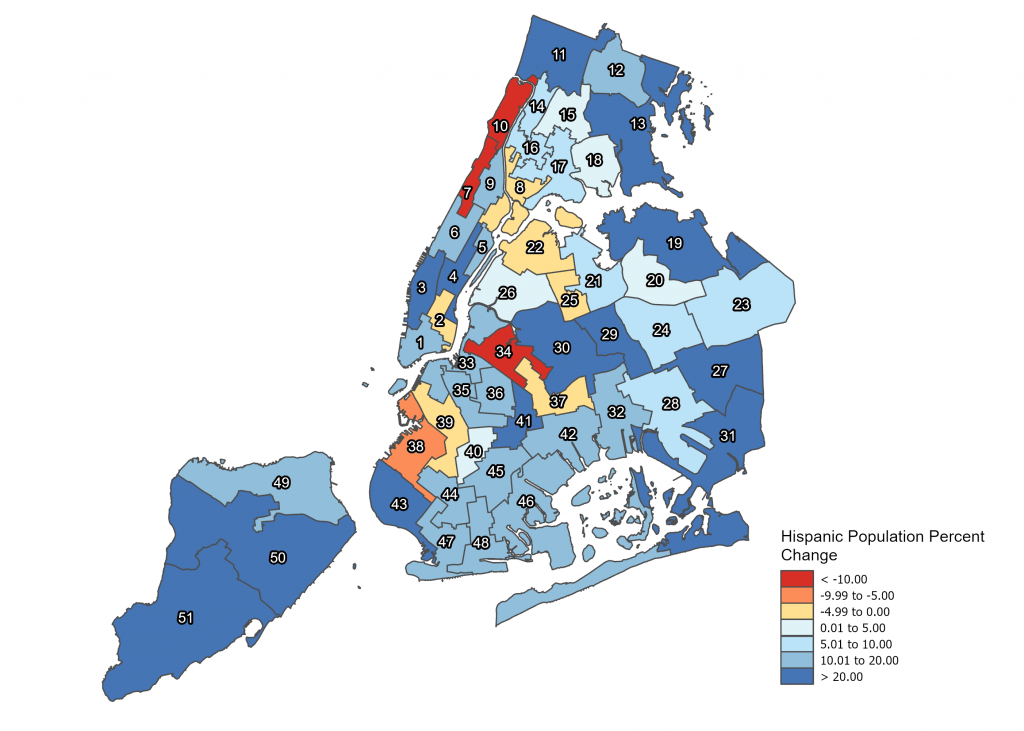
Source: U.S. Census Bureau, 2020 Census Redistricting Data (Public Law 94-171), Table P2
In all districts in which growth exceeded 25% between 2010 and 2020 (i.e., Districts 4, 19, 3, 51, 43, 41 and 27), the Hispanic population was a numerical minority, ranging between 8% and 19% of the district’s population. In districts in which growth was more than double the Hispanic citywide population growth (6.6%), the Hispanic population ranged between being a minority (e.g., Districts 48, 5 and 44) and being the plurality (e.g., Districts 11, 13, 49 and 32). Other districts in which the Hispanic population grew between their citywide growth rate and double that rate, by and large, were districts in which Hispanics were alternatively a clear majority or a minority. Districts in which the Hispanic population declined tended to be mostly districts with Hispanic majorities (e.g., Districts 8, 37 and 10) or pluralities (e.g., Districts 7 and 34). Districts in which numerical growth exceeded more than 10,000 Hispanics tended to be districts with Hispanic pluralities (i.e., Districts 11 and 13) or in which Hispanics exceeded their citywide percentage (e.g., District 30). Districts in which Hispanics grew by more than 5,000 people tended to be districts that included both Hispanic pluralities (e.g., Districts 49 and 32), Hispanic majorities (e.g., Districts 21, 19, 17, 15 and 14), but also districts in which Hispanics were below their citywide share (e.g., Districts 19, 3, 12 or 43). As with proportional declines, districts with numerical declines of Hispanics tended to be districts in which Hispanics were the majority (e.g., Districts 10, 8 and 37) or a plurality (e.g., Districts 7 and 34).
Figure 3. Total Non-Hispanic White Population Change at the Council District Level (in percentage), 2010-2020
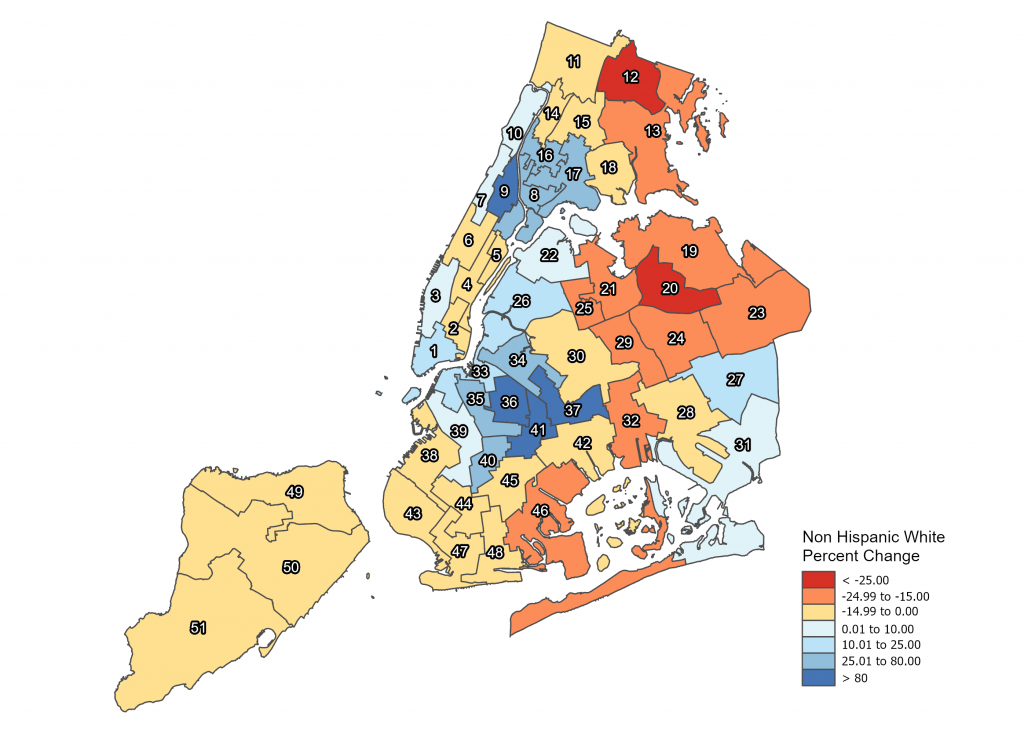
Source: U.S. Census Bureau, 2020 Census Redistricting Data (Public Law 94-171), Table
The non-Hispanic white population remained virtually unchanged in five districts, grew in 20 council districts and declined in 26 districts. Both the growth and the decline in some districts has been dramatic, whether proportionately or in absolute terms. For instance, non-Hispanic whites grew by more than 26,000 persons in Districts 33 and 36, declined by more than 17,000 persons in District 19, and declined by more than 12,000 persons in Districts 29, 47, 43 and 13. Proportionately, non-Hispanic whites grew sixfold in District 36, fourfold in District 41, and more than doubled in District 37. They declined by a quarter in Districts 23, 12 and 20. None of the 10 districts in which the non-Hispanic white population grew by more than 25% were districts in which this population was the majority or plurality of the district. In the other 10 districts in which the non-Hispanic white population grew by any percentage, they were the majority population in three districts (i.e., Districts 33, 3 and 39) and were the plurality in two districts (i.e., Districts 1 and 22). In absolute numerical terms, non-Hispanic whites were the majority or plurality population in two districts in which they grew by more than 10,000 persons (i.e., Districts 33 and 1, respectively). In other districts in which they had any numerical growth, non-Hispanic whites were similarly the majority in two additional districts (i.e., Districts 3 and 39) and the plurality in another one district (i.e., District 22). On the other hand, in the 10 council districts in which they lost more than 8,000 persons, non-Hispanic whites were the majority in one (i.e., District 50) and the plurality in another five districts (i.e., Districts 30, 29, 47, 43 and 19). The 16 council districts in which the non-Hispanic white population declined by more than 10% were more heterogeneous, representing the plurality in only five of those districts. In another 10 districts in which the non-Hispanic white population declined but in smaller percentages, they were the majority population in six districts (i.e., Districts 2, 4, 48, 51, 44 and 50). In five additional districts in which their population did not substantially change between 2010 and 2020, non-Hispanic whites were the majority in two (i.e., Districts 5 and 6).
The non-Hispanic black population increased in population in 26 council districts, remained virtually the same in four other districts, and declined in 21 districts. Non-Hispanic blacks grew proportionately the most in districts in which they were not the majority or the plurality. This was the case in 15 districts in which they grew by more than 10%, topping at 60% (i.e., District 44). Non-Hispanic blacks were the majority in three districts in which their population grew by up to 9% (i.e., Districts 46, 31 and 12) or in one district in which their growth remained virtually unchanged (i.e., District 42). However, they were the majority (i.e., Districts 27, 45 and 41) or the plurality (i.e., Districts 9, 28, 35, 40 and 36) in eight of 15 districts in which they declined proportionately, their decline ranging between 6% and 30%. This decline in majority or plurality non-Hispanic black districts was most evident in absolute numbers in which the decline exceeded more than 5,000 persons. Absolute increases in the non-Hispanic black population took place in both majority-black districts (i.e., Districts 46, 31 and 12), but also in districts in which the non-Hispanic black population was in the numerical minority (e.g., Districts 17, 3, 13 and 8).
The non-Hispanic Asian population grew proportionately in 48 districts, ranging between 6% and more than 150%, declining in three districts (i.e., Districts 15, 1 and 14). In absolute terms, their growth ranged between 400 persons (i.e., District 16) and 21,200 persons (i.e., District 20). In 13 high-growth districts in which non-Hispanic Asians increased by more than 10,000 persons, they were the majority or plurality in six districts. But proportionately, the highest growth rate for non-Hispanic Asians took place in districts in which they were a numerical minority (e.g., Districts 41, 36, 35 and 18) in which their population numbers more than doubled. In Asian-majority or -plurality districts, however, their growth rate ranged between 17% and 33%, which is still above their citywide population growth rate (16%).
The Hispanic population by national origin at the council district level
Puerto Ricans were the majority Hispanic origin group in three council districts (i.e., Districts 2, 18 and 8), two in which Hispanics were the majority population (i.e., Districts 18 and 8) (see Table 8). In addition, Puerto Ricans were the plurality Hispanic group in another 16 council districts (i.e., Districts 51, 42, 12, 39, 34, 33, 46, 38, 13, 41, 17, 50, 49, 37, 1 and 36), ranging between 37% and 49% of those districts’ Hispanic population. Of these 16 districts, Hispanics were the majority population in two (i.e., Districts 17 and 37) and the plurality in three (i.e., Districts 34, 13 and 49).
Dominicans were the majority Hispanic group in four council districts (i.e., Districts 10, 14, 7 and 16), in three of which Hispanics were the majority population (i.e., Districts 10, 14 and 16). Dominicans were also the most numerous (i.e., plurality) Hispanic group in three more council districts (i.e., Districts 15, 11 and 9), ranging between 38% and 47% of those districts’ Hispanic populations. Hispanics were the district’s majority population in one (i.e., District 15) and the plurality in another (i.e., District 11).
Collectively, South Americans were the majority Hispanic grouping in one council district (i.e., District 25), and they were the plurality in another 10 districts (i.e., Districts 21, 22, 26, 19, 29, 30, 23, 20, 24 and 32). In one of these districts in which South Americans were the plurality, Hispanics were the majority population group (i.e., District 21), and the plurality population group in another (i.e., District 32). Mexicans were the plurality Hispanic group in four council districts (i.e., Districts 44, 47, 40 and 48), ranging in share of the Hispanic population from 31% to 43%. In none of these districts were Hispanics a majority or plurality of the district’s population.
Change in the Hispanic population by national origin at the council district level
The Puerto Rican population declined in New York City overall as well as in the Bronx, Brooklyn and Manhattan while growing in Queens and Staten Island. At the council district level, the population of Puerto Ricans remained virtually unchanged in three districts, grew in 18 districts and declined in 30 districts (see Table 9). Their rate of growth, in districts in which their numbers increased, ranged between 1% and 36% while their rate of decline ranged between 1% and 50%. By and large, Puerto Ricans grew in districts in which Hispanics were not a majority of the district’s population (e.g., Districts 48, 31, 51 and 19). The only districts in which Puerto Ricans grew and Hispanics were the plurality or the majority of the district’s population were Districts 13, 32, 49 and 21. The Puerto Rican population tended to decrease at a rate ranging between 13% and 33% in districts where Hispanics were the majority or the plurality of the district’s population (e.g., Districts 17, 11, 18, 16, 37 and 14). However, both their greatest declines and their slowest declines tended to be in districts in which Hispanics were not the plurality or majority of the district’s population (e.g., Districts 22, 39, 38, 23, 12 and 25).
Dominicans grew in 40 council districts throughout New York with rates of growth ranging between 1% and 192%. They doubled their numbers in the population of four districts (i.e., Districts 12, 51, 13 and 48), tripled their growth in two districts (i.e., Districts 4 and 5) and grew fourfold in one district (i.e., District 47). While Dominicans grew in districts in which Hispanics were not the majority or plurality of those districts’ population, they nevertheless increased in population in 11 districts in which Hispanics did represent the majority (i.e., Districts 18, 15, 17, 16, 8 and 14) or the plurality (i.e., Districts 13, 11, 49, 32 and 37). On the other hand, Dominicans lost population in 11 districts, declining between 2% and 25%. Hispanics were the majority population in two districts in which Dominicans lost population (i.e., Districts 10 and 21) or the plurality (i.e., Districts 7 and 34).
Mexicans grew in 33 council districts with growth rates ranging between 1% and 137%. The districts in which Mexicans grew the most were districts in which Hispanics were not the plurality or majority of the population (e.g., Districts 47, 30, 9 and 12). In districts with Hispanic majorities or pluralities in which the Mexican population grew, their growth tended to be below 35% e.g., Districts 32, 11, 16, 10, 14 and 49). The Mexican population remained virtually unchanged in three districts (i.e., Districts 7, 31 and 40) while it declined in 15 districts, five of which were districts in which Hispanics were the majority (i.e., Districts 18, 17, 37 and 8) or plurality (i.e., District 34).
Collectively, the South American population grew in 34 council districts, remained virtually unchanged in one and declined in 16 districts. There were five council districts in which the South American population either doubled or tripled its numbers between 2010 and 2020 (i.e., Districts 41, 36, 45, 35 and 40). In another eight districts, the South American population grew by more than one-third. Of these 13 relatively high-growth districts for South Americans, only two districts had Hispanic majorities (i.e., Districts 18 and 10). This population also increased between 3% and 32% in another 21 districts. These additional growth districts included 12 districts in which Hispanics were the majority (i.e., Districts 14, 21, 15, 18 and 8) or the plurality of the population (i.e., Districts 34, 13, 32, 11 and 49). Districts in which the South American population declined included two Hispanic-majority districts (i.e., Districts 37 and 16) and one Hispanic-plurality district (i.e., District 7). Decreases ranged from 2% to 39%.
In a pattern similar to that of South Americans, the Central American population, collectively, grew in 38 council districts, remained stable in one district and decreased in 12 other districts. Central Americans grew the most in districts in which Hispanics were not the majority population. This population doubled or tripled in four districts (i.e., Districts 51, 48, 43 and 50). They also grew by more than one-third in an additional 14 districts. Hispanics were the majority or the plurality in three of 18 Central American high-growth districts (i.e., Districts 21, 49 and 13). In the remaining 20 districts in which Central Americans grew but by less than one-third, Hispanics were the majority in five (i.e., Districts 14, 16, 18, 10 and 15) and the plurality in two more (i.e., Districts 32 and 11). They were the minority population in the remaining thirteen districts. Central Americans decreased between 2% and 47%, including in two districts in which Hispanics were the majority (i.e., Districts 8 and 37) and in two districts in which Hispanics were the plurality (i.e., Districts 7 and 34).
Distribution of languages spoken at home
One aspect that is relevant for redistricting is the distribution of the population that speaks languages other than English, and who may be identified as protected minority language groups. Both the federal Voting Rights Act as well as the constitution of the state of New York protect such persons’ ability to have access to voting and elect representatives of their choice. However, this consideration is seldom taken into account as a criterion in drawing legislative districts. We present data herein on the distribution of languages other than English in New York City, its constituent boroughs and in council districts.
The majority (52%) of the population in New York City (five years of age and older) reports speaking English and only English in 2020 (see Table 10). Another 24% of the city’s population spoke Spanish, 13% spoke some other Indo-European language, 9% spoke a language originating in Asia or islands in the Pacific Ocean while 3% spoke some other language.
Of those who spoke English in addition to another language, 36% spoke English “well” (10%) or “very well” (26%). Therefore, those persons who reported being able to speak the English language with ease were 88% of New York City’s population. But the distribution of the population that spoke only English or spoke it very well, if they spoke another language, is not uniform throughout the city. Staten Island had the greatest proportion (67%) of city residents who spoke only English followed by Manhattan (61%) and Brooklyn (56%). In each of these boroughs, the majority of the population spoke only English. In Queens, about 45% of the population spoke only English; 42% did so in the Bronx.
Similarly, the distribution of the population who spoke a language other than English also varied geographically. Spanish is most prevalent in the Bronx with nearly half of the borough’s population (47%) speaking it. Following the Bronx, Queens had the most Spanish-speakers (23%) with Manhattan (21%), Brooklyn (15%) and Staten Island (11%) after those two boroughs. Brooklyn (18%), Queens (15%) and Staten Island (13%) had greater proportions of speakers of some other Indo-European language than Manhattan (8%) or the Bronx (6%).
Queens had proportionately about twice (15%) as many speakers of languages from Asian or the islands in the Pacific than Brooklyn (9%), Manhattan (8%) or Staten Island (7%), and many more than the Bronx (1%). The speakers of another language in addition to English were more evenly distributed throughout the city: the Bronx (5%), Staten Island (4%) and Brooklyn (3%), and Manhattan (2%) and Queens (2%).
Of the 12% of the population who did not speak English well or at all, 6% were Spanish-speakers, with greater proportions in the Bronx (13%) followed by Queens and Manhattan (6%). About 3% of speakers of an Asian or Pacific Islands language did not speak English well or at all with Queens being home to a larger proportion (6%) than the other boroughs: Brooklyn (4%), Manhattan and Staten Island (2%), and the Bronx (0.4%). Of those who speak another Indo-European language but do not speak English well or at all (2%), there was an overproportion in Brooklyn (4%) and Queens (3%) relative to Staten Island or the Bronx (1%).
The geographical distribution of those persons whose ability to speak English less than well or not at all was also varied at the council district level. While 12% of the city’s population did not speak English well or at all, their distribution at the council district level varied between 5% (e.g., Districts 4 and 6) and 53% (i.e., District 20). There were 33 council districts in which the population that did not speak English well or at all exceeded the citywide average. In fact, there were 14 council districts in which the population spoke English less than well or at all at rates exceeding 25% of the districts’ population (i.e., Districts 20, 21, 48, 25, 38, 47, 44, 14, 19, 24, 16, 43, 26 and 15). These tended to be districts that had a majority Asian population (e.g., Districts 20 and 25) or Hispanic population (e.g., Districts 21 and 14), but also included districts in which no single ethnic group was the majority of the district (e.g., Districts 38, 47 and 24).
In the nine council districts in which Hispanics were the majority of the population (i.e., Districts 21, 14, 10, 17, 15, 8, 16, 18 and 37), all exceeded the citywide average of residents who did not speak English well or at all, ranging between 15% and 35% (see Table 11). In another eight districts in which Hispanics were at least one-third of the population, those Hispanic residents who spoke English less than well or not at all ranged between 9% and 20%. However, there has been enormous growth among Spanish-speakers who do not speak English or do not speak it well in districts with low proportions of Hispanics (e.g., Districts 19, 5, 47, 4 and 30). In these districts, the percentage of growth in the Spanish-speaking population who spoke English less than well ranged between 135% and 400%.
Income distribution
Income is a sociodemographic factor with implications for political participation. The political science literature has shown consistently how income affects voter registration and voter turnout in the United States, whether at the federal, state or municipal levels. Unlike race, ethnicity and language, which are factors subject to scrutiny and protection of federal and state authorities for the purposes of voting, income is not institutionally subjected to such scrutiny. But given its impact at the individual-level, it is pertinent to describe its distribution geographically. After all, our society is segmented not only along race and ethnicity, but income and class as well. In the space below, we breakdown household income by race and ethnicity as well as borough and district council levels.
The median household income for the city as a whole was $67,046 in 2020 (see Table 12). But it varied by borough and ethnic makeup of the population. Manhattan had the highest median household income with $89,812, followed by Staten Island with $85,381, Queens with $72,028, Brooklyn with $63,973 and the Bronx with $41,895. In terms of ethnicity, the group with the highest median household income was non-Hispanic whites with $97,841, followed by Asians with $72,181, and people who indicated two or more racial categories when defining their race with $63,440. Black New Yorkers had a median household income of $51,171 followed by American Indians with $49,345, Hispanics with $46,896, and Native Hawai’ians with $46,521. The population group in New York City reporting the lowest median household income were those who chose a racial category different from those offered by the U.S. Census Bureau (i.e., “Other”) with $42,458. At the intersection of ethnicity and geography, the highest median household income was found in non-Hispanic whites residing in Manhattan ($130,419) while the lowest was reported among American Indians in the Bronx ($26,186).
Of the 51 council districts in which the city is divided, 28 exceeded the citywide $67,046 median household income and another 23 districts fall below this benchmark (see Table 13). Council districts in Manhattan have the distinction of including districts with the highest and among the lowest household incomes. Districts 3, 4, 5 and 6 exceed $120,000 in median household incomes. District 8, on the other hand, had a median household income of $32,350, the district with the second lowest household income. By and large, Hispanic-majority districts tend to be in districts with the lowest median household incomes. In fact, of the 10 districts with lowest median household districts in the city, seven are Hispanic-majority districts (i.e., Districts 17, 8, 16, 14, 15, 18 and 37). Moreover, Hispanic households in these Hispanic-majority districts tend to have lower household incomes than the district as a whole. In fact, Hispanic households have lower household income than the district’s overall household income in 38 districts across the city.
Figure 4. Distribution of Median Household Income and Hispanic Population at the Council District Level, 2020
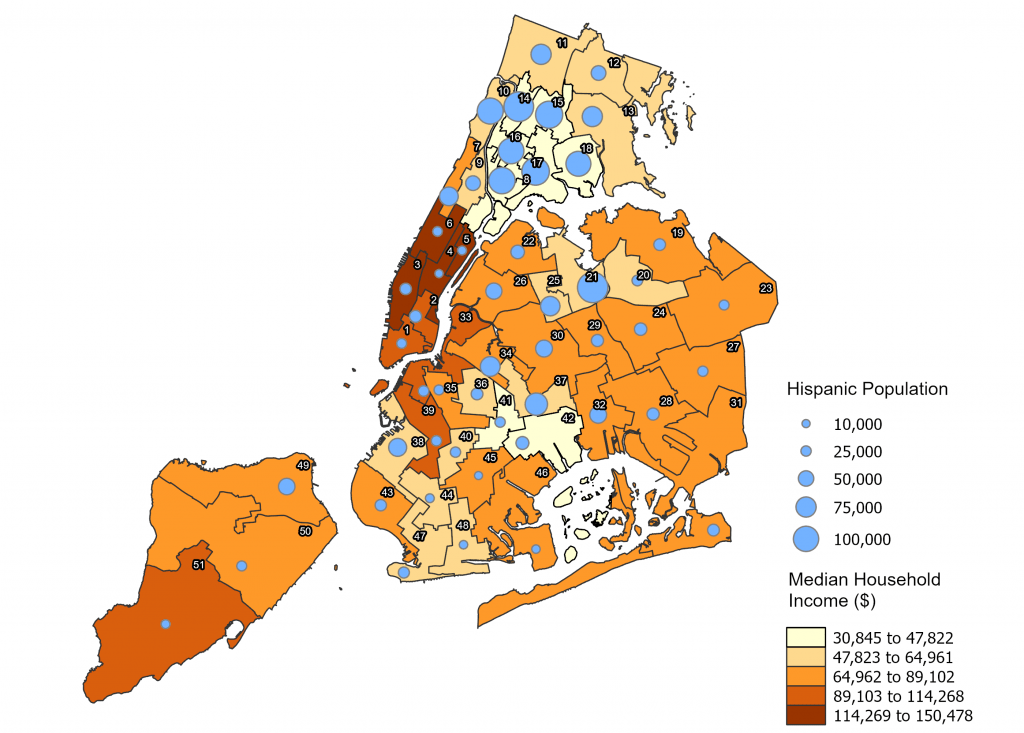
Source: U.S. Census Bureau, American Community Survey, 5-yr estimates, 2020, Table S1903
New York City’s Districting Commission Preliminary Plan
The New York City Districting Commission has drawn 29 majority districts and 22 plurality districts. Of the 51 districts preliminarily drawn, non-Hispanic whites represent a majority in 11 districts and the single largest population group (i.e., plurality) in another nine (see Appendix 1). Hispanics represented the majority population in 10 districts and the plurality in five more. Blacks are the majority in six preliminary districts and the plurality in another five districts. Asians are the majority population in two districts and the plurality in another three districts. This outcome overall is surprising when compared to the composition of current council districts in light of the 2020 decennial census.
Presently, 28 of the current council districts are majority districts, in which a single ethnoracial group is the majority of the district’s population. In another 23 districts, no single ethnoracial group represents the majority of the population of the district even if one single group may capture a greater proportion of the population (i.e., plurality). Specifically, non-Hispanic whites are the majority in 11 council districts and the plurality in another eight districts. Hispanics are the majority in nine districts and the plurality in another six districts. Blacks are the majority in seven districts and the plurality in another four districts. Asians are the majority in one district and the plurality in five districts.
Given the decennial census results, which showed a slight decrease in the non-Hispanic white population, it is not surprising to see preliminary plans that maintain the number of majority non-Hispanic white districts at 11. But the preliminary plans increase the number of non-Hispanic-white plurality districts to nine from eight; this is a 13% increase. In contrast, the number of Hispanic-majority districts increased from nine to 10—an 11% increase—but the number of Hispanic-plurality districts decreased from six to five—a 17% decrease. For non-Hispanic Asians, the increase of Asian-majority districts from one to two represents a 100% increase, but the decrease of Asian-plurality districts from five to three represents a 60% decrease. The decrease of one non-Hispanic black-majority district from the current configuration to the proposed preliminary plan is a 14% decrease while the increase of one black-plurality district is a 13% increase.
The difference in the district’s population distribution in the preliminary plan that seems to give an advantage to the non-Hispanic white population is evident in how those plans affect plurality districts. For instance, under the present configuration of district lines, 41% of District 7 is Hispanic and 28% is non-Hispanic white. Under the preliminary plans, the Hispanic population in District 7 declines to 35%, while the non-Hispanic white population increases to 34%. The Hispanic population in District 7 did decline 12.7% between 2010 and 2020 under current district configurations while the non-Hispanic white population increased by 7%. However, the proportional decline in the Hispanic population in District 7 under the preliminary plan is 15% compared to the disproportionate increase of 21% for the non-Hispanic white population. In District 7’s adjacent district (i.e., District 10), which experienced a similar Hispanic population decline (i.e., -11%) and a similar non-Hispanic white population increase (i.e., 9%) between 2010 and 2020, the proportional population change under the preliminary district plans is -0.9% and -3% for Hispanics and non-Hispanic whites, respectively. Population configurations based on council district boundary changes do not appear commensurate with actual population changes in these two districts.
Similar lines of disproportionality while drawing new district boundary lines are evident in District 32. The Hispanic population represents 34.8% of the population in District 32 under the current district’s configuration, while the non-Hispanic white population is 33%. However, under the Districting Commission’s preliminary plans, both the Hispanic and the non-Hispanic white populations increased their proportion of the district’s population—to 38.5% and 36%, respectively—when the Hispanic population grew by 13% while the non-Hispanic white population declined by 15% between 2010 and 2020 within those proposed boundaries.
More stark are the changes that have taken place in Districts 26 and 38, changes that seemingly position the non-Hispanic white population for descriptive representation at the expense of Hispanics and Asians. Presently, under current district lines, District 26’s population is evenly divided between non-Hispanic Asians, Hispanics and non-Hispanic whites at 31%, 29% and 29%, respectively. But under the preliminary plan, the proportions of these population groups shifted to 25% non-Hispanic Asian, 22% Hispanic and 44% non-Hispanic white; this is despite the growth between 2010 and 2020, which was by 34% for non-Hispanic Asians, by 0.3% for Hispanics and by 22% for non-Hispanic whites.
In District 38, the non-Hispanic Asian population currently represents 40% of the present district, Hispanics represent 36% of the population, while non-Hispanic whites represent 17%. Between 2010 and 2020, the non-Hispanic Asian population within the present district’s boundaries grew by 21%, Hispanics declined by 6% and the non-Hispanic white population declined by 0.9%. Yet, under the Districting Commission’s preliminary plans, non-Hispanic Asian will be 16% of the district’s population, Hispanics will be 35% and non-Hispanic whites will be 42%, a disproportionate configuration of a district.
Another feature of the Districting Commission’s preliminary plans that reveals disproportionality in the configuration of districts’ population stems from the deviation from the target population size any council district should have. The number of people a district should have since the last redistricting process in 2013 is 172,882 persons. By and large, the districts drawn in the preliminary plan deviate by less than one percent from the target population size of 172,882. However, there are three preliminary districts whose populations deviate substantially from that target. These three districts are located in Staten Island, and their populations fall about 7,400 persons short of the ideal 172,882 persons population target.
From a numerical perspective, districts with fewer residents are thought of as having greater political power as it takes fewer voters to elect a representative that has the same voting power in the Council as residents of districts with more residents. Adherence to the one-person, one-vote principle prevents deviation from numerical equality in population for congressional districts. However, in the case of municipal councils, districts may be drawn with deviations that should not exceed 10% from the target population. That is, the districts with the smallest and largest population cannot exceed 10%. These three districts in Staten Island have about 4.2% less population than the 172,882 benchmark, raising questions about the fairness of these districts relative to others in the city even if they are within procedural bounds.
Furthermore, while deviations from the benchmark population in other districts preliminarily presented by the Districting Commission outside those in Staten Island are small, generally falling below 1% in difference, there is nevertheless an evident association between districts in the preliminary plans with greater proportions of Hispanics having slightly greater populations than districts with greater proportions of non-Hispanic whites, which are associated with slightly smaller populations.