Redistricting 2020: The Prospects of Increasing Hispanic Legislative Representation in Florida
Sections
Introduction
County-level Changes
Population Changes at the Congressional District Level
A Note on Florida's Hispanic Population
Increasing Hispanic Legislative Representation
Appendices
Notes
Introduction
Hispanics are driving population growth across the United States. This lead in population growth affords Latinos the opportunity to increase their political power by potentially increasing the number of legislative districts that can be represented by them. This report provides an overview of population changes in the state of Florida, showing how Hispanic population growth outpaces that of other groups in the state and across counties.
The addition of one congressional seat to the state’s delegation improves the chances of increasing Hispanic congressional representation in Central Florida as well as in county legislatures (i.e., boards of commissioners) across the state. Puerto Ricans are a leading group driving this population growth, especially as they continue to settle in Central Florida counties.
On April 26, 2021, the U.S. Census Bureau delivered to the president of the United States results from the 2020 decennial census to be used for apportionment. The apportionment results showed that the state of Florida’s delegation in the U.S. House of Representatives will increase to 28 representatives for the next ten years beginning with the 118th Congress (2023-2025).ii Apportionment is the process by which the 435 seats in the U.S. House of Representatives are divided among the 50 states of the union. This is a constitutionally-mandated task based on the decennial enumeration the Census Bureau conducts.iii The constitution guarantees each state one representative in the House of Representatives; the remaining 385 seats are then apportioned based on each state’s total population.iv
This increase of one representative in the state’s congressional delegation was expected given the population increase Florida experienced between 2010 and 2020. Between decennial censuses, the state’s population grew by 14.1%. This rate of growth earned Florida eighth place as the state with the largest population growth behind Utah, Idaho, Texas, North Dakota, Nevada, Colorado, and Washington but ahead of more than 40 other states (see Table 1). The rate of growth of the national population was 7.1%; therefore, Florida’s growth was nearly twice as large as the national rate of growth. As a result of gaining one additional seat in the House of Representatives, Florida’s congressional delegation will be the third largest in the country after California and Texas.
In 2010, Florida’s apportionment population of 18,900,773, divided among 27 congressional districts, yielded districts with 700,029 persons per district.v In 2020, the total reapportionment population of 21,570,527, divided among 28 congressional districts, would yield districts with a population of approximately 770,376 persons per district.vi However, as of 2020, Florida’s population at the district level ranged between 727,465 and 955,602, a difference of more than 228,000 persons.
Table 1. Population Change by State, 2010 – 2020
You may sort the table by clicking a column name.
As a result, Florida will need to redraw its congressional district boundaries for all its 28 districts to have an equal number of persons in them,vii a process known as redistricting.viii With the increase in overall congressional representation and the growth rate of the Hispanic population, specifically Puerto Rican representation in Central Florida, it is feasible to expect an increase in Hispanic congressional representation.
This brief focuses on Florida’s demographic changes at the county and congressional district levels that are likely to influence the congressional redistricting process in the state. Under normal circumstances, the Census Bureau would have released redistricting data based on the decennial census of the population by April 2021. However, the Census Bureau had announced that this redistricting data would not be available until September 2021, a six-month delay.ix
County-level Changes
Figure 1. Total Population Change by County, 2010-2020
As noted, the state of Florida has had one of the fastest growing populations in the United States, and while most of the state has grown in population, this growth has not been evenly distributed. Population estimates between 2010 and 2020 show that 50 of Florida’s 67 counties increased their population while 17 counties declined in population (see Table 2). Of the 55 counties that had an increase in population, 20 counties increased at a greater rate of growth than the state overall (14%).x An additional 17 counties grew between 7% and 14% and 13 counties had growth rates of up to 7%.
Table 2. Rate of Growth of the Population by Ethnicity and Race at the County Level, 2010-2020
You may sort the table by clicking a column name.
Most of the growth took place in counties along Interstate Highway 4 (I-4) and in counties adjacent to those along the I-4 corridor.xi These fast-growing counties were also among those that grew their populations not only proportionately but in absolute number of people. Orange and Hillsborough counties grew by more than 200,000 people while Lee, Polk, and Osceola counties grew by more than 100,000 people.xii Counties that saw large population increases were also the most populous counties in the state: Miami-Dade (205,000), Broward (196,000), and Palm Beach (172,000), which are located on the southeast coast of the state. On the other hand, virtually all the counties that experienced a decrease in population between 2010 and 2020 are located in the north of the state with many along the Florida Panhandle, which borders the states of Georgia and Alabama.xiii However, 4 counties with declining population were located in the central region of the state.xiv
Between 2010 and 2020, Florida’s population grew across all ethnic and racial groups, although this growth varied by social group. The fastest growing segments of the state’s population were non-Hispanics who identified with more than one race (172%), followed by Hispanics (35%) and non-Hispanic Asians (41%) (see Table 3). Of these groups, Hispanics had the largest effect on population growth as they were the group with one of the largest shares of the population (26.5%). By comparison, non-Hispanic whites, the largest group in the state (51.5%), grew by less than 2% and non-Hispanic blacks, the third largest group in the state, grew by nearly 10%.
Table 3. Florida Resident Population Change by Ethnicity and Race, 2010-2020
You may sort the table by clicking a column name.
Figure 2. Non-Hispanic White Population Change by County, 2010-2020
Figure 3. Hispanic Population Change by County, 2010-2020
As with the distribution of the population by county, not all ethnoracial groups were evenly distributed across the counties and neither were their growth. For instance, the non-Hispanic white population grew in 35 counties but declined in 32 counties. In the six counties in which the non-Hispanic white population grew, it did so at rates higher than the statewide rate of growth (14%) (see Table 4). Within 18 counties, this population also grew at a rate that was between the state’s overall growth rate and the statewide rate of growth for non-Hispanic whites (2%); in 10 additional counties, the rate was up to 2%. On the other hand, in 15 of the 32 counties that saw a decline, the non-Hispanic white population declined by up to 5% and between 5%, and 12% in the remaining 17 counties. In contrast, Hispanics grew in 61 of Florida’s 67 counties while they declined in six counties.xv Moreover, this population grew at rates greater than its statewide rate of growth (35%) in 39 counties, and between 14% (the state population’s overall rate of growth) and 35% in the another 15 counties. In seven counties, the Hispanic population grew at rates of growth lower than the state’s overall growth rate. The non-Hispanic black population grew in 39 counties.
The growth rate of the non-Hispanic black population was higher than their overall statewide growth (10%), in 23 counties. Their population growth was lower than 10% in 16 counties. However, in 28 counties, the non-Hispanic black population declined between 0.5% and 42%.
Overall, between 2010 and 2020, Florida’s Hispanic population grew in more counties and at greater rates of growth than non-Hispanic whites. The non-Hispanic black population grew at rates that were between those of the Hispanic and non-Hispanic white populations. Non-Hispanic Asians and non-Hispanic multiracial Floridians showed growth patterns similar to Hispanics, growing in 66 counties (Asians) or all 67 counties (multiracial).
Table 4. Population Change by Ethnicity and Race at the County Level, 2010-2020
You may sort the table by clicking a column name.
Population Changes at the Congressional District Level
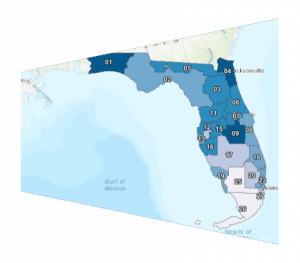
Figure 4. Total Population Change by Congressional District, 2010-2020
The population grew in all 27 congressional districts between 2010 and 2020, even if the rate of growth varied between 37% (by 259,000 persons—District 9) and 4.5% (by 31,000 persons—District 2) (see Table 5). But as was the case at the county level, most of the population growth at the congressional district level took place in Central Florida, along the I-4 corridor and adjacent districts (9th, 16th, 1st, 4th, 11th, 10th, 12th, 19th, and 15th districts).
Table 5. Population Change by Ethnicity and Race by Congressional District, 2010-2020
You may sort the table by clicking a column name.
Consistently driving the population growth in these Central Florida districts and other congressional districts across the state was the growth in the Hispanic population. In 20 of the 27 districts, the Hispanic population grew at rates greater than its statewide growth rate (35.2%), and they grew above the overall statewide growth rate (14%) in five additional districts. Districts in which population growth was slowest (25th, 26th, and 27th districts) were also districts in which Hispanics made up over 70% of the population.
Non-Hispanic blacks had similar population growth profiles at the congressional district level as Hispanics, growing at rates greater than their statewide growth rate (9.7%) in 15 districts. The non-Hispanic black population grew at a lower rate in six other districts.
In contrast with Hispanics and non-Hispanic blacks, the non-Hispanic white population increased in 13 congressional districts and decreased in 14 districts between censuses. They exceeded their statewide rate of growth (2%) in all 13 districts in which their proportions increased. However, the non-Hispanic white population growth did not surpass the state’s overall rate of growth (14%) in any congressional district. Non-Hispanic whites saw their steepest population decline mostly in districts in which they were in the numerical minority (20th, 22nd, 23rd, 26th and 27th districts).
As noted above, redistricting will entail a readjustment to the boundaries of legislative districts for all of them to have equal populations. Given how Hispanic growth has driven population growth at the state, county, and congressional levels, it is expected that redistricting will reflect this growth.
Figure 5. Non-Hispanic White Population Change by Congressional District, 2010-2020
Figure 6. Hispanic Population Change by Congressional District, 2010-2020
A Note on Florida's Hispanic Population
As noted above, Hispanics represent the second largest population group in the state (26.5%), and was still one of the fastest growing group in Florida (34.9%). However, the more than 5,697,000 people who were classified as Hispanic, Latino, or of Spanish origin in 2019 did not constitute a homogeneous group despite the similarities they may share; rather, this population is very diverse.xvi One salient issue of difference is national origin. The Hispanic population in Florida has varied in national origin over the decades as Hispanics have migrated from Latin America, the Caribbean, and elsewhere in the United States to make the state their home.
Traditionally, Cubans have been the most prominent group in Florida in terms of their population numbers and salience politically, economically, and culturally. In 2019, the Cuban population represented 28% of the Hispanic population within the state—the single largest Hispanic national origin group—followed by Puerto Ricans (21%), Mexicans (13%), Colombians (7%), Venezuelans (4.8%), and Dominicans (4.5%) (see Table 6). Therefore, no single national origin group comes close to representing the overall majority of the state’s Hispanic population.xvii However, at scales below the state (e.g., county, congressional district), there are distinct patterns of population settlement in which specific national origin Hispanic groups appear to predominate.
Table 6. Hispanic Population in Florida by Specific Origin, 2019
For instance, in 2019, there were three counties in which Hispanics represented the majority of the county’s population: Miami-Dade (68.5%), Osceola (54.1%), and Hendry (53.7%) (see Table 7). In turn, in each of these counties, there was a single Hispanic national origin group that made up the majority of Hispanics: Cubans (53%) in Miami-Dade, Puerto Ricans (59.5%) in Osceola, and Mexicans (60.7%) in Hendry. Mexicans represented the overwhelming majority (more than 80%) in Hardee (43.6%) and DeSoto (31.6%), which had the highest proportion of Hispanics. In fact, the Mexican-origin population was the majority of the Hispanic population in seven counties across the statexviii and represented the plurality in 28 other counties.xix Similarly, Puerto Ricans represented the majority in four countiesxx and the plurality in 21 other counties.xxi Cubans, in contrast, were the majority Hispanic population in two counties (Miami-Dade and Monroe) and the plurality in another (Lafayette).
Table 7. Distribution of Florida’s Hispanic Population by County, 2019
You may sort the table by clicking a column name.
Meanwhile, South Americans were the plurality in three counties (Broward, Madison, and Palm Beach) and Other Hispanics were the plurality in one county (Baker). In terms of a pattern for this distribution and the prevalence of either Mexicans or Puerto Ricans as either the majority or plurality of the Hispanic population in a given county, it appears that Mexicans are more prevalent in counties where the Hispanic population is relatively small, whereas Puerto Ricans tend to be prevalent as the leading Hispanic national origin group in counties with relatively greater proportions of Hispanics.xxii
At another scale—the congressional district—the pattern of Hispanic national origin group settlement was different from what appears at the county level. Hispanics are the majority in three congressional districts (25th, 26th, and 27th) (see Table 8). In these three districts, in which Hispanics represented more than 70% of the districts’ population, the Cuban population was the majority (greater than 50%). In three other districts (9th, 23rd, and 24th) in which Hispanics represented a large plurality of the population (around 40%), Puerto Ricans were the majority population in one district (9th), Cubans were the plurality in another ( 24th), and South Americans were the plurality in the third district (23rd). In congressional districts in which Hispanics represented less than one-third of the population, Cubans were the plurality group in one congressional district (14th), Puerto Ricans were the plurality group in 11 districts;xxiii Mexicans were the plurality in 6 districts;xxiv and South Americans were the plurality in one district (22nd).
Table 8. Population Change by Congressional District in Florida by Hispanic Specific Origin, 2010 -2019
The growth of the different Hispanic national origin groups in Florida has not been uniform either. Venezuelans were the fastest growing Hispanic national origin group, more than doubling (137%) their numbers in the state between 2010 and 2019, followed by those who did not specify a national origin (i.e., Other Hispanic or Latino: 68%), Bolivians (67%), and Guatemalans (64%) (see Table 8). However, in terms of total number of people, Puerto Ricans grew the most (326,000) between 2010 and 2019, followed by Cubans (324,000), Venezuelans (158,000), and Mexicans (125,000).
Another characteristic of the Hispanic population in the state pertinent to the redistricting process is the proportion of people who are eligible to register to vote because they are citizens of the United States and 18 years of age or older. In 2019, this proportion was 57%, which is notably lower than Florida’s overall population (72.2%). The difference between the Hispanic citizen voting-age population (CVAP) and that of the overall population stems from two factors: the higher percentage of youth in its midst and the lower proportion of citizens.
Nearly one-quarter (24%) of Hispanics in Florida were minors compared to 19.7% of Florida’s overall population. Moreover, of the adult population, 60% of the state population was born in the United States and are, therefore, U.S. citizens compared to 32% of Hispanics. Among the 20% of foreign-born persons in the overall population, 12% were naturalized citizens while 8% were not citizens. Therefore, the 60% of adults who were native-born citizens and the 12% of adults who were naturalized citizens bring the total CVAP to 72%. The comparable proportions among 44% of Hispanic adults who were born outside the United States show that 25% were naturalized citizens while 19% were not citizens. Correspondingly, 32% of adult Hispanic U.S.-born citizens and 25% of adult Hispanic naturalized citizens bring their CVAP to 57%.
The CVAP, and, therefore, the eligibility to register to vote, varies by national origin group. Puerto Ricans, as born U.S. citizens, exhibited the highest CVAP at 70%, which is close to the statewide average.xxv Spaniards had a CVAP of 65% and Cubans and Dominicans had a CVAP of 55%. Collectively, the voting eligibility was 48% for South Americans, 39% for Central Americans, and 34% for Mexicans.
Increasing Hispanic Legislative Representation
These distinct patterns of Hispanic population distribution, whether at the county level or the congressional district level, indicate how Hispanic representation may be increased in the upcoming redistricting process. Presently, Florida’s congressional delegation includes four Hispanic members of the House of Representatives (Soto, Díaz-Balart, Giménez, and Salazar) and one Hispanic senator (Rubio). If ethnicity were the only or the most salient criterion for redistricting, then potentially up to seven representatives in the state delegation might be Hispanic given their numbers in the state’s population.xxvi That is, as the state’s Hispanic population in 2020 was 5,697,240, and each congressional district is to have 769,221 persons, seven Hispanic representatives might be elected if districts were drawn in a manner that discretionarily distributed the state’s Hispanic population. Yet, as has been noted, the Hispanic population in the state is not evenly distributed and existing districts have tended to concentrate Hispanics in a few of them. Districts with overwhelming majority Hispanic populations already result in Hispanic descriptive representation (i.e., the election of a Hispanic representative), but so may districts with a large plurality of Hispanics, such as the 9th district. A redistricting process that takes into account a large plurality of Hispanics in a legislative district, but not necessarily an overwhelming majority, may still yield Hispanic political representation.
Considering the above-average population growth in counties and congressional districts along the I-4 corridor, the possibility of creating a district that may result in the election of a Hispanic representative is feasible. Moreover, considering that a large growth of the Hispanic population in Central Florida has stemmed from growth in the Puerto Rican population, drawing a district to accommodate the increase in the state’s congressional delegation with a large plurality or simple majority of Hispanics may result in the election of another Hispanic member of Congress and increase its state congressional representation from four to five.
Another institution for potential growth in Hispanic representation is the county board of commissioners. Florida’s 67 counties are each governed by a board of commissioners. In most cases (85%), these county boards of commissioners are made up of five elected commissioners. However, six counties have seven commissioners, and one county has six commissioners. Furthermore, some of the largest counties have even more commissioners: Duval (19), Miami-Dade (13), and Broward (9). In total, these commissions have some 374 commissioners.
Another institution for potential growth in Hispanic representation is the county board of commissioners. Florida’s 67 counties are each governed by a board of commissioners. In most cases (85%), these county boards of commissioners are made up of five elected commissioners. However, six counties have seven commissioners, and one county has six commissioners. Furthermore, some of the largest counties have even more commissioners: Duval (19), Miami-Dade (13), and Broward (9). In total, these commissions have some 374 commissioners.
More than 80% of county commissioners are non-Hispanic whites, about 13% are non-Hispanic blacks, and less than 5% are Hispanics. This is in a state in which Hispanics represent more than one-quarter of the population. Admittedly, and as it has been noted throughout this brief, the Hispanic population is not distributed evenly throughout the state or throughout the different counties (see Appendix B). The county population of Hispanic origin in 2020 ranged between less than 3% (Baker and Gulf counties) and 68% (Miami-Dade). But even in counties in which the Hispanic population constitutes a sizable portion of the population, Hispanics are still underrepresented on county boards of commissioners. For instance, in counties with five commissioners, a social group representing 20% of the CVAP might see one representative on the board of commissioners. But this would result to the extent that such 20% of the population was concentrated in a specific area in which they represented either the majority of voters or a large plurality, as would be the case if the board of commissioners were divided into discrete geographical districts. However, if commissioners are elected at-large, in which all the voters in the county can vote for all the candidates running for commissioner, then the social group in question may never muster enough votes to elect a candidate of their preference. This is often the case in Florida in which most of the county boards of commissioners are not elected at the district-level; rather, they are elected at-large. More than half (56%) of counties in the state elect their boards of commissioners on an at-large basis. Moreover, six counties conduct elections through a mixed system in which most commissioners are elected in district-level elections, and some are elected at-large. Only 23 of Florida’s counties exclusively elect commissioners in district-level elections.
Hispanics’ share of the county population is lower than 20% in 49 counties; it is greater than 20% but lower than 40% in another 14 counties. Hispanics exceed 40% of the county’s population in four counties, yet, there are commissioners of Hispanic origin in only 10 county boards of commissioners.xxvii There are 10 counties in which the Hispanic population was greater than 20% of the county’s population, but no commissioner was Hispanic.xxviii Of these 10 counties, seven had at-large election systems but, correspondingly, three of the counties had district-level or mixed election systems.xxix Moreover, of the 10 counties that had Hispanic representation on their boards of commissioners, Hispanics were still underrepresented in three of those counties based on their share of the county’s population.xxx District-level election systems increase Hispanic representation on county boards of commissioners. However, to assure a representative allocation of commission seats on a board of commissioners, district-level boundaries need to be carefully considered.
Appendices
Appendix A. Share of Congressional Districts’ Population by Ethnicity and Race, 2020
You may sort the appendix by clicking a column name.
Appendix B. Share of ‘s Population by Ethnicity and Race, 2020
You may sort the appendix by clicking a column name.