Puerto Rico’s 2020 Population Decennial Analysis

Sections
Key Findings
Island-Wide Population Shift
Comparing Decennial Census Data Across the Decades, 1980 to 2020
Population Change by Municipalities
The Outlook
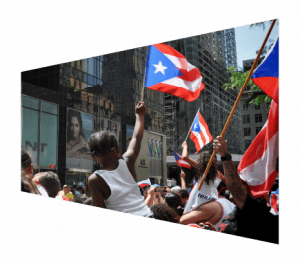
Photo by Andy Orin on Unsplash
Key Findings
The newly released 2020 decennial data for legislative redistricting highlights the following for Puerto Rico:
- Puerto Rico’s population dropped by -11.8% percent between 2010 and 2020: a historic loss of 440,000 individuals in a 10-year span.
- Population loss for Non-Hispanic residents was disproportionately lower, at only 1.3%
- Puerto Rico had the absolute largest population decline of any US jurisdiction, sharply disproportionate to any state.
- For the first time in history population losses were reported across all municipalities, with San Juan showing the greatest overall loss.
Island-Wide Population Shift
Puerto Rico’s population declined from 3,725,789 in 2010 to 3,285,874 in 2020, an -11.8 percent change according to the 2020 decennial census, resulting in a population loss of 440,000 in a 10-year span. According to the U.S. Census Bureau, only 3 other states in the U.S. showed any decline in population between 2010 and 2020. Puerto Rico had the absolute largest population decline, compared to West Virginia (-3.2%), Mississippi (-0.2%), and Illinois (-0.1%).
While the United States saw a modest population growth (7.1%), Puerto Rico showed a rapid population decline in the past decade. This is partly attributable to demographic shifts such as low fertility rates among women and migration to the U.S. mainland (Abel & Deitz 2014). The 2006 economic crisis also contributed to population decline between the decades, as both high unemployment rates and financial instability pushed working age adults to find better economic opportunities in the U.S. mainland, especially after the elimination of the IRS Section 936 (Feliciano 2018). Finally, the 2017 natural disasters of Hurricane(s) Irma and Maria also spurred Puerto Rico’s population decline in terms of migration. Since Hurricane(s) Irma and Maria, migration has intensified, especially among adults and the children accompanying them (family units), and this pattern shifted the Island’s demographic structure (Hinojosa, Meléndez, and Pietri 2019) .
Comparing Decennial Census Data Across the Decades, 1980 to 2020
Figure 1. Puerto Rico’s Total Population
Population results from the 2020 census show a worsening pattern of decline that had already been noted for the first time in 2010. At that time census results showed the first decline in population in more than 200 years. As shown in figure 1, in 1980 the U.S. Census reported 3.1 million people living in Puerto Rico, this increased by 10 percent in 1990 to 3.5 million. This represented an addition of 325,517 residents between 1980 and 1990. Population growth continued to rise steadily between 1990 and 2000, from 3.5 million to 3.8 million, adding 286,573 residents (see figure 1). During this period, Puerto Ricans in Puerto Rico outnumbered stateside Puerto Ricans. Between 1990 and 2000, the population increased by 8 percent, this was the last time population increase was seen in Puerto Rico. By 2010, the population had declined by 2 percent, from 3.8 million to 3.7 million, indicating a loss of 82,821 residents from the prior decade. Between 2010 and 2020, Puerto Rico entered a phase of both economic austerity and back-to-back natural disasters. In other words, in the recent 10 years, from 2010 to 2020, Puerto Rico lost about 440,000. This is much higher than the population gained between 1980 and 1990, thus, Puerto Rico’s current population effectively mirrors its 1980 population. The population loss of 439,915 between 2010 to 2020 is about 4 times larger compared to -82,821 in the 2000 to 2010 period alone.
Population Change by Municipalities
Figure 2. Population Change by County: 2010 to 2020
For the first time in history, the new 2020 decennial data revealed population decline across all municipalities in Puerto Rico. In previous decades, some municipalities lost population while others gained. For instance, between 2000 and 2010, 36 out of 78 municipalities showed population increases (see Appendix A). This was not the case between 2010 and 2020.
The greatest population declines were seen in the San Juan metropolitan area. As shown in figure 2, San Juan had the largest absolute decline, with a loss of 53,067 residents or -13% percent change since the last decade. This was followed by -28,836 (-17 percent change) in Ponce, -28,836 (-11 percent change) in Bayamón, -16,003 (-18 percent change) in Mayagüez, -15,649 (-12 percent change) in Carolina , -14,316 in Caguas (-11 percent change), -8,748 (-19 percent change) in Guayama, -8,686 (-9 percent change) in Arecibo, and -8,144 (-8 percent change) in Guaynabo.
Figure 3. Percentage Change in Population by County: 2010 to 2020
Thirty-one municipios lost population at rates higher than Puerto Rico as a whole, ranging from -12% in Morovois to -29% in Guánica. As shown in figure 3, Guánica accounted for a 29 percent decline followed by Maricao (-24%), Loíza (-21%), Yabucoa (-20%), Guayama (-19%), Arroyo (-19%), Yauco (-19%), Mayagüez (-18%), Cataño (-18%), and Guayanilla (-18%). Spatially, southwest and southeast coastal municipalities showed the highest population percent change (with the exception of Maricao and Loíza).
As shown in figure 3, population percent change was lower in municipalities with low population counts. That was the case for Rincón (-0.1%) followed by Culebra (-1%), Naranjito (-4%), Bararanquitas (-4%), Aibonito (-5%), Isabela (-6%), Dorado (-6%), Moca (-7%), Camuy (-7%), and Corozal (-7%).
The Outlook
The 2020 decennial census revealed a stark demographic reality for Puerto Rico that has been unfolding in the past decade. From a demographic perspective, Puerto Rico’s aging, fertility rates, and out-migration may have serious social and economic implications.
Appendix A. Population Change by Municipality, 2000 to 2020
You may sort the Appendix by clicking a column name.
Authors