Pervasive Poverty in Puerto Rico: a Closer Look
Sections
Key Takeaways
Introduction
Conclusion
References
Key Takeaways
- Pervasive poverty in Puerto Rico is rooted in its loss of economic comparative advantage in the regional (i.e., circum-Caribbean) and national (i.e., United States) markets as a result of congressional actions over which Puerto Rico had little input or leverage. Puerto Rico’s economy is therefore unable to produce sufficient jobs at levels of remuneration that would keep persons who are able and willing to work above the federal poverty level.
- Puerto Rico’s pervasive poverty is disproportionate to other U.S. jurisdictions, more than three times as high as that for the United States as a whole, more than twice as high as for the poorest states of the union and higher than all but one other U.S. territory.
- All 78 county-equivalents (i.e., municipios) continue to exhibit levels of poverty that qualify them as counties of persistent poverty.
- Pervasive poverty in Puerto Rico affects women and children disproportionately. More than half the children (56%) lived level below poverty in 2021.
- The majority of family households with children lived below the poverty level, and the more children there are in the household, the greater the likelihood members of such a household will live in poverty.
- Poverty in Puerto Rico is correlated with employment—most family households in Puerto Rico (58%) that do not have a worker in them are below the poverty level. Nevertheless, poverty is present in households with full-time, year-round workers, with up to a quarter of some of those family households with full-time workers living below the poverty level.
Introduction
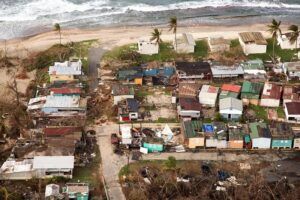
On November 15, 2022, the U.S. House of Representatives Subcommittee on Housing, Community Renewal, and Insurance held a hearing entitled “Persistent Poverty in America: Addressing Chronic Disinvestment in Colonias, the U.S. Territories and the Southern Blackbelt.” Dr. Yarimar Bonilla, then CENTRO’s director, provided testimony concerning Puerto Rico and other U.S. territories. These jurisdictions the subcommittee focused on have historically had high rates of poverty; higher relative to other places in the United States. Puerto Rico’s poverty and overall economic conditions have fluctuated over the decades, taking a clear turn for the worse beginning in 2006 with an enduring economic crisis made worse with the natural disasters that struck Puerto Rico in 2017 and 2020; and hampered even further by the SARS-CoV-2 pandemic beginning in 2020. This congressional hearing spurred us at CENTRO to take stock of current conditions of poverty in Puerto Rico in an effort to direct policymakers’ attention to a pervasive problem. Its persistence is rooted in structural conditions and institutional frameworks. This report expands on CENTRO’s testimony before Congress, providing a more detailed analysis of pervasive poverty in Puerto Rico.
The U.S. government defines “persistent poverty counties” as those that maintained poverty rates of 20% or more for at least 30 years. 1 Under this definition, all of Puerto Rico experiences persistent poverty, and it has done so for more than half a century. In 2021, the last year for which data are available, the percentage of the population of Puerto Rico living below the federal poverty level was 43%.2 Puerto Rico’s levels of poverty were three times as high as the 12.6% of the U.S. population overall that lived below the poverty level, and it was more than twice as high as those of states with the highest rates of poverty: Louisiana (18.8%), New Mexico (18.3%) and Mississippi (19.4%) (see Appendix A).
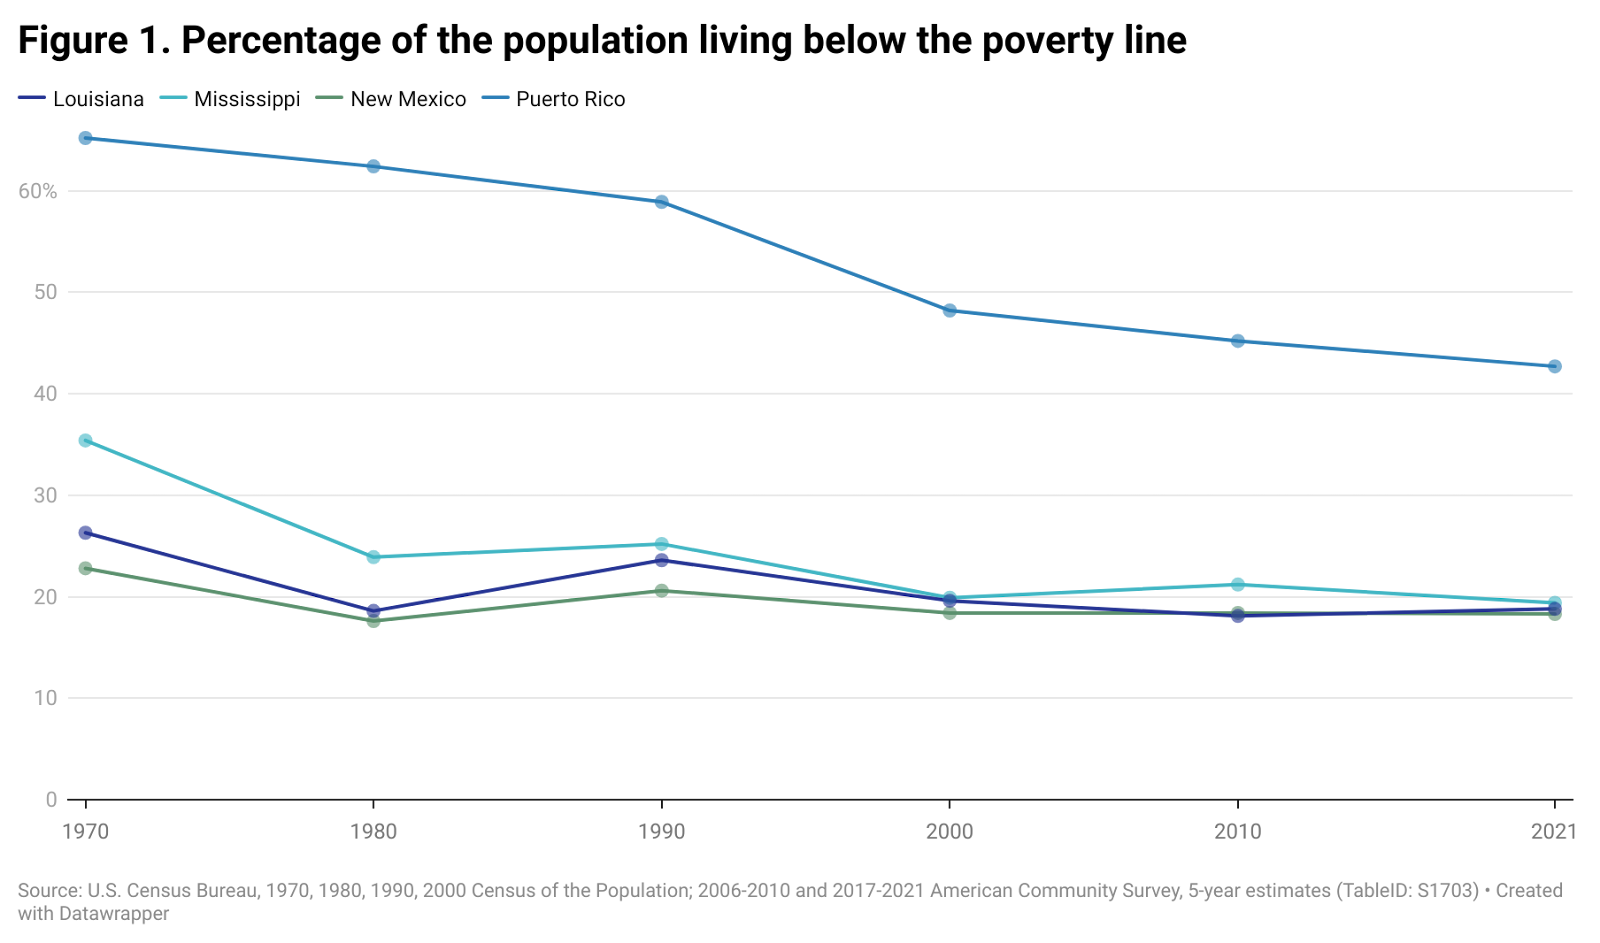
This higher level of poverty in Puerto Rico relative to the United States and individual states of the union is not a new phenomenon but rather a persistent trend that has existed for decades, beyond the three-decade-threshold established by the U.S. government as benchmark. As Figure 1 indicates, Puerto Rico’s high poverty rates date back decades, in all instances exceeding the poverty rates of any state of the union. For instance, in 1970, 65.2% of Puerto Rico’s population lived below the poverty level, compared with 13.7% of the U.S. population as a whole, 23% of New Mexico’s population, 26% of Louisiana’s population or 35% of Mississippi’s population. While the historical trends indicate that poverty over the last 50 years has diminished in Puerto Rico as well as in the states with the highest rates of poverty, Puerto Rico’s levels of poverty remain disproportionately high.
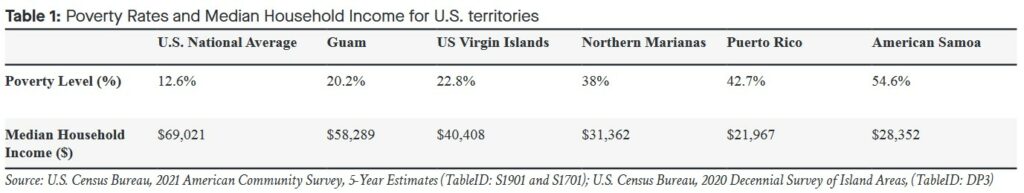
However, this disproportion in poverty levels between Puerto Rico and the states of the union is not as apparent as with other U.S. territories. That is, Puerto Rico’s poverty rate is higher than it is in Guam (20.2%) and the U.S. Virgin Islands (22.8%), territories with rates comparable to those of the poorest U.S. states. But Puerto Rico’s poverty rate is similar to that of the Commonwealth of the Northern Marianas (38%) and lower than American Samoa (54.6%) (see Table 1).3 These differences in poverty rates between U.S. states and U.S. territories and among U.S. territories are embedded in the political relationship between each of the territories and the United States, given how the U.S. Congress treats territories different from U.S. states, but also differently from each other. Therefore, any attention to and corrective action against persistent poverty in Puerto Rico and other territories must be grounded on the disparate treatment Puerto Rico and some of the other U.S. territories pervasively receive from Congress and Executive Office agencies.
A closer look at the nature of poverty in the territories is in order, considering U.S. territories tend to be out of the attention of most federal policymakers but for the most extreme circumstances. However, while comparisons between territories are always possible, the idiosyncratic relationship between each of the disparate territories and the U.S. government makes comparisons between them somewhat tenuous.4 The remainder of this report surveys the profile of the poor in Puerto Rico, the largest and most populous U.S. territory, using the latest available 2021 American Community Survey data. It does so in order to identify the areas towards which anti-poverty measures can be directed to ameliorate and reverse pervasive conditions of poverty among the population. The report highlights the reasons why some segments of the population (e.g., children, women, rural highland residents) are more likely to live below the poverty rate. The data presented show how poverty in Puerto Rico is underscored by limited work opportunities in Puerto Rico and the corresponding low levels of household income. Moreover, the data also indicate that the ability of Puerto Rico’s economy to create jobs is tied to its political relationship with the United States and its position in the regional political economy.
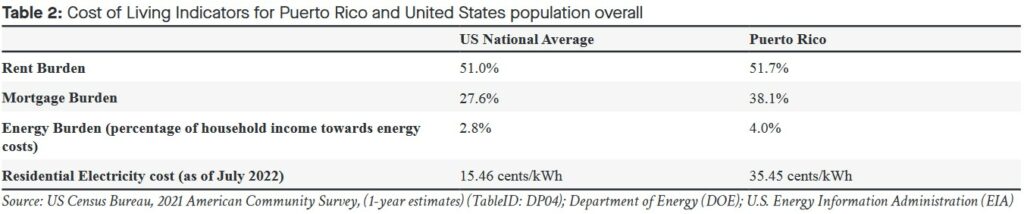
Some might assume that these depressed incomes are tied to a lower cost of living in Puerto Rico; nevertheless, rent, mortgage, and utility burdens are as high or higher in Puerto Rico than in U.S. states (see Table 2).
Rather, the disproportionately high rates of poverty in Puerto Rico are rooted in the limited ability of its economy to provide sufficient jobs to sustain its population, in the distribution of existing jobs among the working age population and how the income generated in Puerto Rico’s economy is distributed throughout the population. As a result of these conditions, there is a large segment of the prime working age population not employed or even in the labor market and therefore unable to provide an income that can sustain individuals or families; a large proportion of children live in poverty as a result of living in households that do not produce enough material resources to provide for them; and the economy is not capable of producing enough jobs at living wages for people capable and willing to work. At bottom, the capacity of Puerto Rico’s economy to produce enough economic activity and employment opportunities for its working age population is circumscribed by Puerto Rico’s political relationship with the United States.
Who is poor in Puerto Rico?
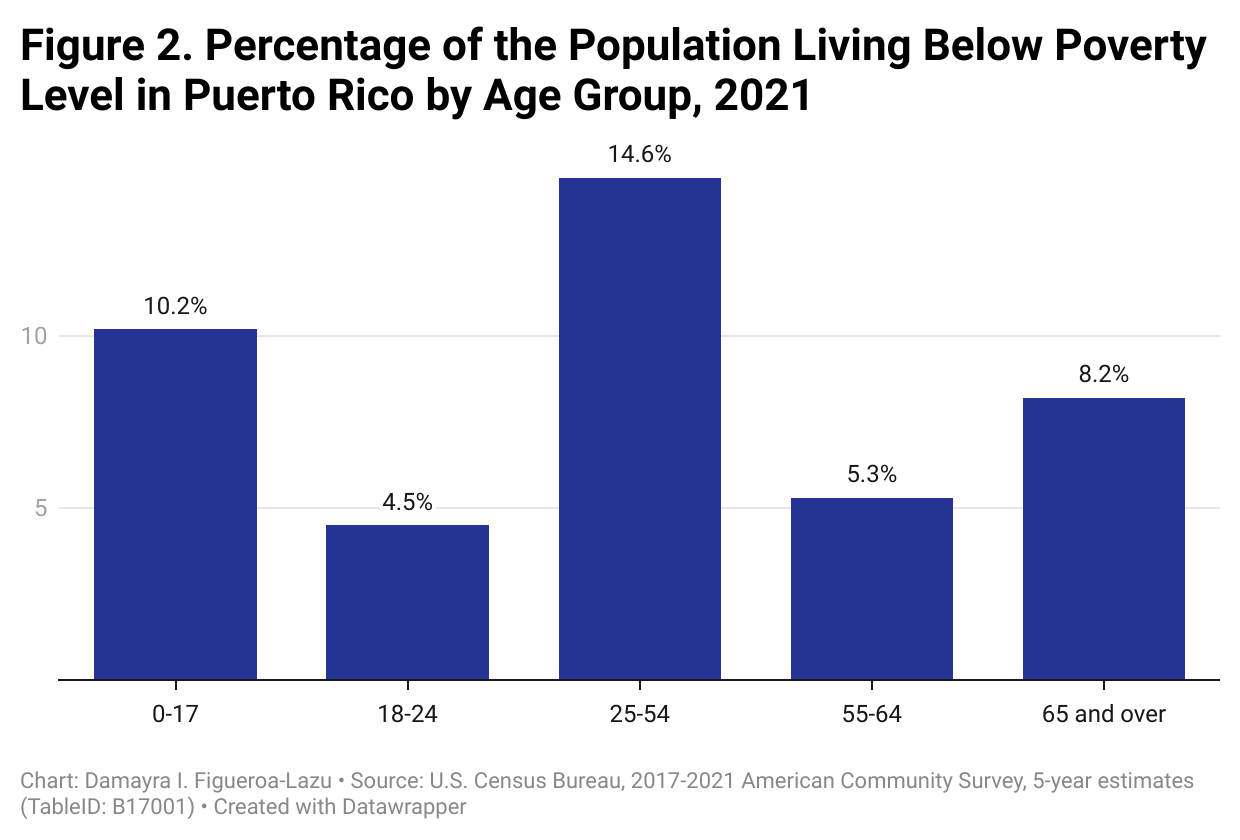
Poverty affects Puerto Ricans differentially, depending on their age, sex, and where they live.5 Racial disparities are also evident in poverty rates.6 Of the 42.7% of Puerto Rico’s population that lived below the poverty level in 2021, the broadest segment included individuals in their most productive work years, those between 25 and 54 years of age (14.6% of Puerto Rico’s population) (see Figure 2). The second largest segment of poor individuals is made up of children (from less than one year of age to age 17), who accounted for 10.2% of the total population. Persons 65 years of age and older were the third most numerous category of people who lived below poverty, representing 8% of the entire population. The age groups that bookend the most-productive-age category—those 55 to 64 years of age and those between 18 and 24 years—and lived below the poverty level each represented 5% of Puerto Rico’s population.
Poverty is also projected differently across sex. Of the 42% of the population that was poor in Puerto Rico, women and girls represented 23% of Puerto Rico’s population, while men and boys made up another 19% (see Figure 3). Women were therefore overrepresented among the poor.7 They are also slightly underrepresented among those living above the poverty level.8

This particular sex distribution pattern can also be discerned when disaggregating sex into age categories. Women of prime working-age categories (i.e., 25-54 years) living below the poverty level represented a higher proportion of Puerto Rico’s population (8.4%) than their male cohort counterpart (6.2%) (see Figure). In contrast, women and men 25 to 54 years of age living above the poverty level represented similar proportions of Puerto Rico’s population (12%). For those in the two other typical working age groups (i.e., 18-24 years and 55-64 years) men and women also represented similar proportions of Puerto Rico’s population living below the poverty level (about 2%); so was the case among male and female children (about 5%).
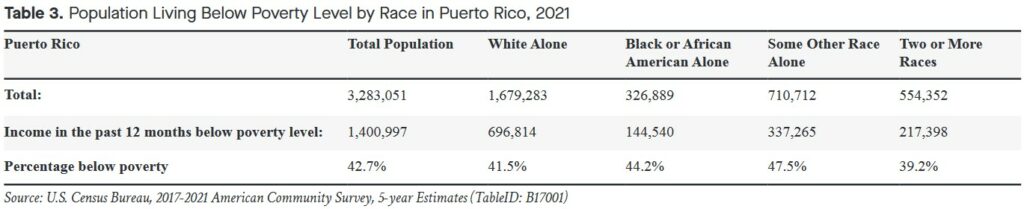
Poverty also differs along racial identity lines. Whereas the rate of people living below the poverty level was 42.7% in 2021, among persons who identified as “white alone,” 41.5% were living below the poverty level; 44.2% of those who identified as “black alone” were also living below the poverty level; 47.5% of those who selected another racial category or label also reported living below the poverty level (see Table 3). On the other hand, of those who identified racially with two or more racial categories, 39.2% lived below the overall poverty level.9
Given this description, it is evident that poverty is not distributed evenly in Puerto Rico’s population. Children are disproportionately exposed to poverty, and so are women of working age. But poverty is also distributed differently depending on where in Puerto Rico a person lives.
Firstly, all 78 municipios (a county-equivalent territorial jurisdiction) into which Puerto Rico is subdivided administratively had more than 20% of their population living below the poverty level in 2021. Every single municipio exceeded this threshold used to establish persistent poverty. Yet, poverty is not distributed evenly across Puerto Rico’s geography.10 There were inordinate high levels of poverty in Central Highland municipios as well as municipios on the West Coast of the main island (see Figure 4). In 16 municipios, the percentage of the population living below the poverty level ranged between 20% and 40%. There were another 38 municipios in which 40% and 50% of the population lived below the poverty level; and 24 municipios in which 50% of the population lived below the poverty level, to a high of 67% (i.e., Adjuntas) (see Appendix B for a detailed geographic distribution).11
Figure 4. Percent of Population Below Poverty Level by Census Tract, 2017-2021
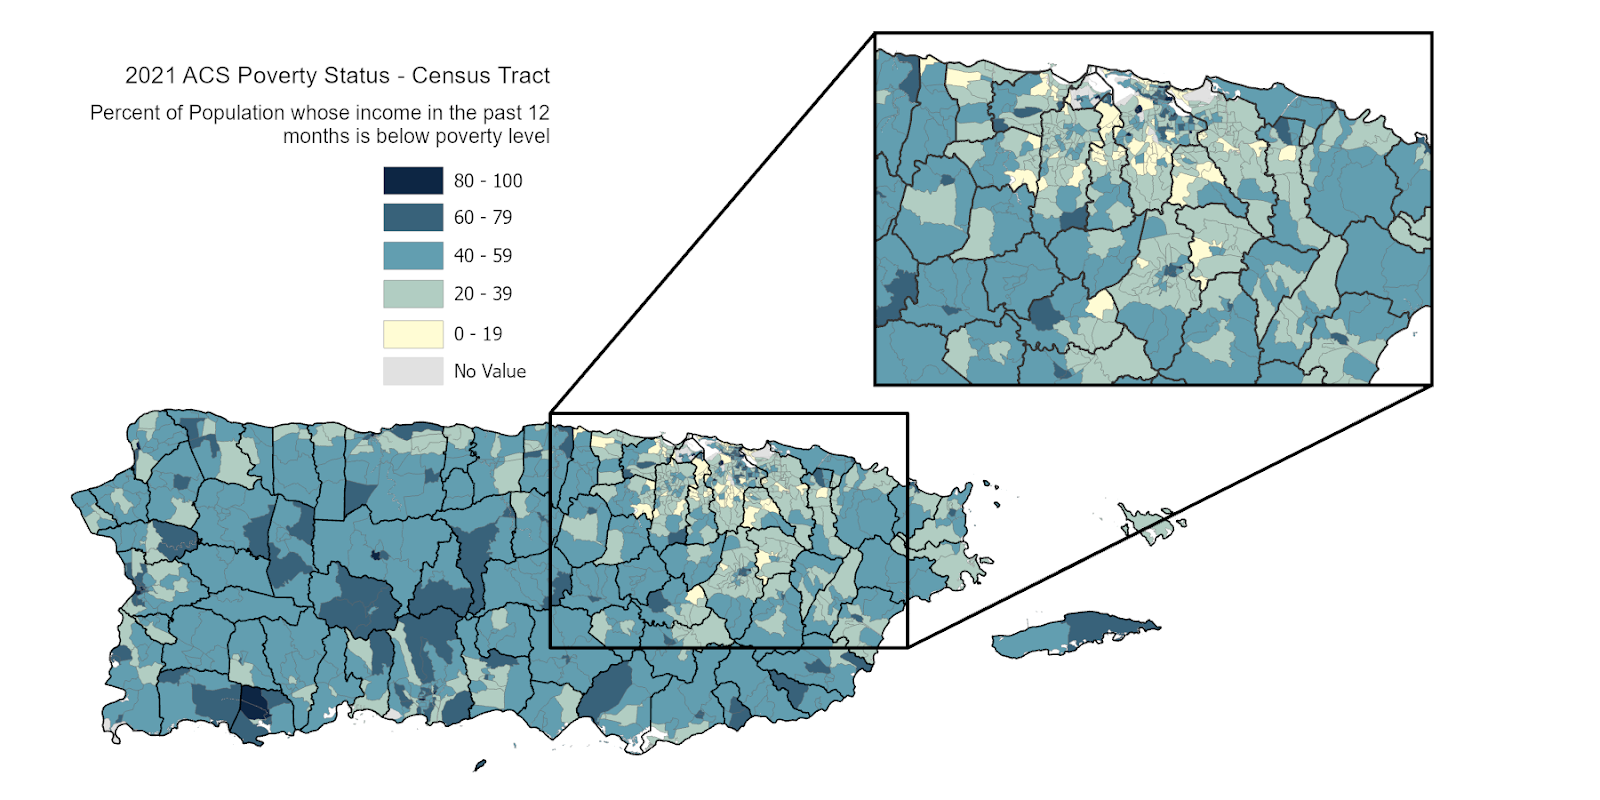
Source: U.S. Census Bureau, 2017-2021 American Community Survey, 5-Year Estimates
Why are these Puerto Ricans poor?
There are a number of reasons that account for poverty in Puerto Rico. For children, the primary reason many live in poverty is that they resided in households that lived below the poverty level. For adults, it centered around the extent to which they participated in the labor force, and if they were in the labor force, whether they were working, and if so, whether they worked on a full-time or a part-time or a seasonal basis or whether they were unemployed but looking for work.
Of all age categories, the children group was the one that included a larger proportion of Puerto Rico’s total population living below poverty (10.2% or 334,027 children) than living above the poverty level (7.9% or 259,272 children) (see Figure 2).12 In fact, from a different analytical perspective, more than half (56%) of children in Puerto Rico lived below the poverty level. For all other age groups, those living above the poverty level outnumbered those living below the poverty level. Yet, a focus on child poverty, and poverty among those with limited or decreasing autonomy to provide for themselves because of advanced age or disability, underscores the structural and institutional reasons for poverty as opposed to attitudinal or “cultural” ones.
Children and household composition
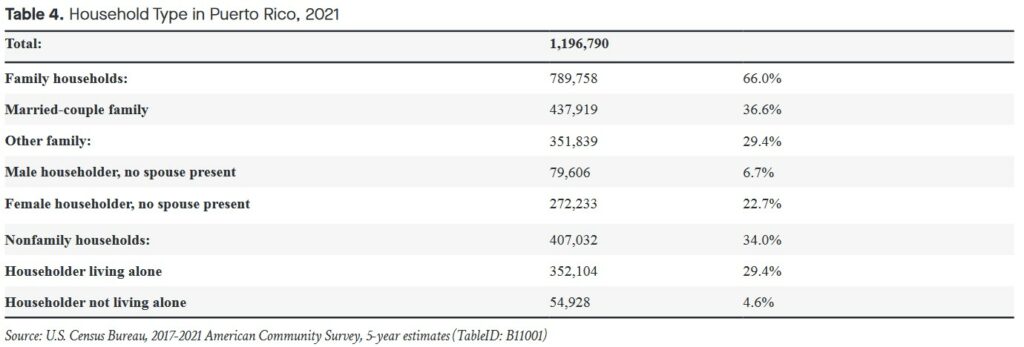
Children, by and large, do not live on their own, but in households, and most often in family households. In 2021, the 3.2 million people living in Puerto Rico resided in 1,196,790 households (see Table 4). Two-thirds of households (789,758) were made up of family households. The most common form of family household was the married-couple family household, representing 37% (437,919) of all households in Puerto Rico. These married-couple households were followed by “other family” households (351,839 or 29%). A large proportion (29% or 352,104) included households of persons living alone, while another 5% (54,928) included households by non-family members.
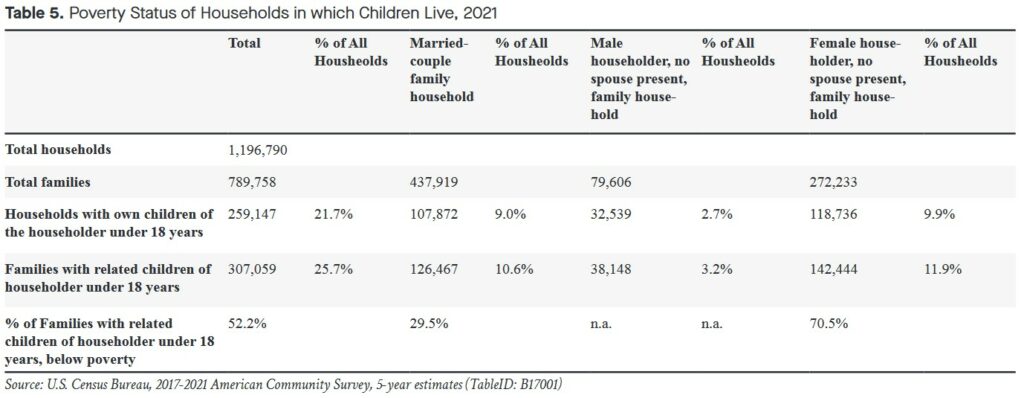
Children were present in about a quarter of households in Puerto Rico. By definition, these children lived in family households.13 About 25% (307,059 households) of the 1,196,790 households in Puerto Rico were family households that included specifically the children of the householder (see Table 5).14 The largest proportion of all Puerto Rican family households with children of the householder (12%) was headed by a woman in which there was no spouse present. Another 11% of households included married-couple with children; while 3% of households were headed by men with their own children but no spouse present.15
Children in households living in poverty
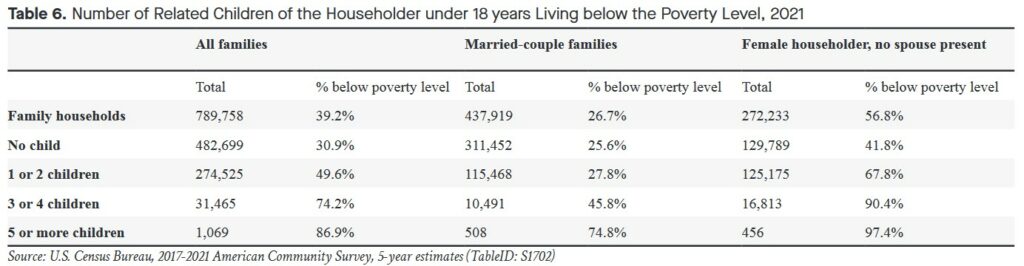
The majority of family households in Puerto Rico (61%) did not include children. A lower percentage of these no-child households also tended to live below the poverty level (31%) than all other family households in Puerto Rico (39%). Moreover, no-child family households had remarkably lower proportions of households living below poverty than family households with children (see Table 6). About half the families with one or two children lived below the poverty level. Nearly three-quarters of families with three or four children lived below the poverty level, and about 87% of families with five or more children lived below the poverty level.16 Proportions of family households living below the poverty level were lower when those households were made up of married-couples. Therefore, 28% of married-couple families with one or two children lived below poverty, compared to 68% of family households in which the head of household was a woman with no spouse present.17 The percentage of families living below the poverty level was even greater (90%) among households with three or four children with a female head of household with no spouse present, more so than the also very high proportion of married-couple families with three or four children living below the poverty level (46%).
As children are dependent on adult members of the household for their material well-being, a look at the characteristics of heads of households as providers of material sustenance is in order. Leading among these characteristics is the ability to produce an income. This ability is marked by a person’s ability to either derive an income from employment or rents produced by investments or transfers from government entitlement or assistance programs.
In 2021, 37% of the 789,758 family households in Puerto Rico did not include a member of the family who worked. Of those no-worker family households, 58% lived below the poverty level. The bulk (56%) of no-worker family households (24% of all households in Puerto Rico) is made up of married-couple families, of which 41% lived below the poverty level (see Table 7). In contrast, no-worker female-headed households with no spouse present represented 9% of all households, but 81% of those households lived below the poverty level. No-worker male-headed households with no spouse present represented 2% of all households, but 74% of those households lived below the poverty level.
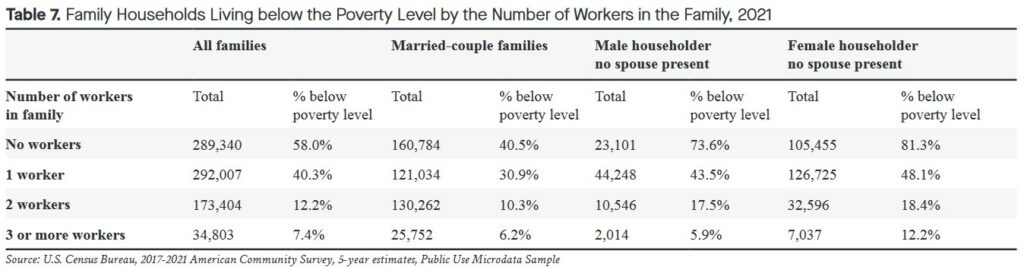
Family households with one worker also represented 24% of all households in Puerto Rico, with the proportion of those living below the poverty level at 40%. One-worker married-couple family households were 10% of all households in Puerto Rico, with 31% of them living below the poverty level. One-worker female-headed households with no spouse present represented 11% of all households, but 48% of them lived below the poverty level. One-worker male-headed households with no spouse present represented 4% of all households, but 44% of those households lived below the poverty level. Two-worker family households represented 14% of all households in Puerto Rico, with 12% of them living below the poverty level. Two-worker married-couple family households represented 11% of all households in Puerto Rico, with 10% living below the poverty level. Two-worker female-headed households with no spouse present represented 3% of all households, of which 18% lived below the poverty level. Two-worker male-headed households with no spouse present represented less than 1% of all households, but 18% of those households lived below the poverty level. Finally, family households with 3 or more workers represented 3% of all households, with 7% of them living below the poverty level.
Unsurprisingly, the more workers a household has, the less likely it is that those households will live below the poverty level. Moreover, the structure of those households also matters for its effect on poverty. Married-couple households are less likely to live below the poverty level when compared with households in which the head of the household has no spouse present. Yet, sex has an inordinate impact on the likelihood that a household will live below the level of poverty. Not only may married couple households be less likely to be living below the poverty level, but male-headed households with no spouse present tend to have somewhat lower rates of living below the poverty level than female-headed households with no spouse present. Furthermore, the latter are much more numerous than the former, skewing poverty outcomes overall. These disparities are tied to the underemployment among women in general relative to men, but especially due to the underemployment among prime working-age women.
Income in working family households is dependent on not simply the number of people who may be working, but also on the number of hours and length of time a working person works. In 2021, 44% of households had a member who worked. Of those who worked, 66% worked on a full-time basis, the previous twelve months. Of the 30% of the 789,758 family households that had a householder who worked full-time, year-round in the previous twelve months, 14% still lived below the poverty level (see Table 8). Married-couple family households in which the head of household worked full-time all year represented 18% of all family households; 8% of those family households lived below the poverty level. Such full-time worker family households headed by a woman without a spouse present represented 8% of all family households, but 22% lived below the poverty level. Those full-time worker family households headed by a man without a spouse present represented 4% of all family households, but 27% lived below the poverty level. Conditions were worse in all types of family households in which the householder worked full-time year-round in the previous year and had related children present: 21% of all such family households, 12% those of married couple families, 29% of female-headed households and no spouse present and 36% of male-headed households and no spouse present lived below the poverty level.
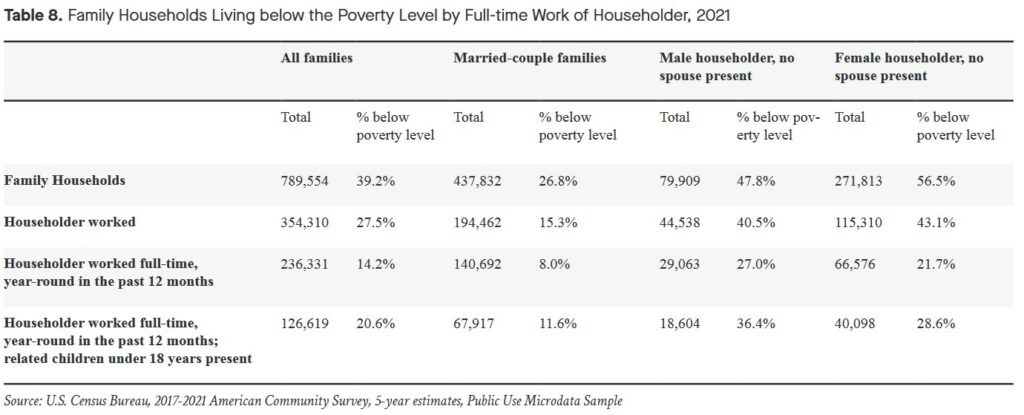
Households with children are at a material disadvantage in Puerto Rico, irrespective of the type of household they live in, when compared with households without children, but particularly so when the households they live in are households with a single head of household and as the number of children in the household increases. While this is driven by the ability of the family to include workers in the household, it is also impacted by the type of work those workers do and by the number of hours they are employed for. Yet, even when working full-time all year round, a sizable percentage of family households (14%) lived below the poverty level.
But most family households in Puerto Rico are not working on a full-time basis 12 months out of the year. This fact begs the question of whether the economy of Puerto Rico can create and provide jobs for all those one million working-age Puerto Ricans able to work. After all, while children are singularly affected by, and inordinately constrained by, the economic conditions of the households they live in, children are only one segment of the population of Puerto Rico that lives under the poverty level. Another sizable segment of the population that lived under the poverty threshold in 2021 included people of working age, particularly those in their most productive years. As noted above, 10% of the nearly 43% of Puerto Rico’s population living below poverty was made up of children. Another 24% of that 43% living below the poverty level were adults between the ages of 18 and 64 years, with nearly 15% between the ages of 25 and 54 years.
Adults and poverty: who works, who earns?
As with households in which children lived, adults living below the poverty level were affected by whether they were part of the labor force and, if they were in the labor force, by whether they were employed or unemployed, and if employed, whether they were employed full-time for the entire year or not. In 2021, 44% of Puerto Rico’s population, 16 years of age and older was in the labor force (see Table 9).18 Therefore, 56% were not in the labor force.19 But not everyone in the labor force had a job or, if they had a job, not everyone worked on a full-time basis 12 months out of the year. Estimates indicate that of the more than 1.2 million persons in the civilian labor force in Puerto Rico, more than one million were employed, while 180,000 were unemployed.20 Of the more than one million employed residents of Puerto Rico, 700,000 were employed on a full-time basis, year-round in the previous 12 months. Another 455,000 persons had worked less than full-time in the previous 12 months.21 Income and earnings levels varied accordingly.
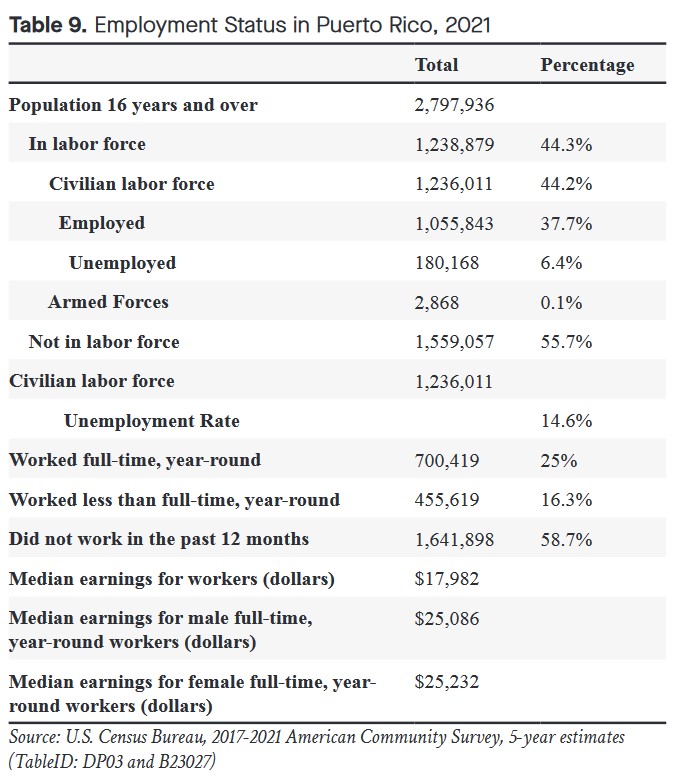
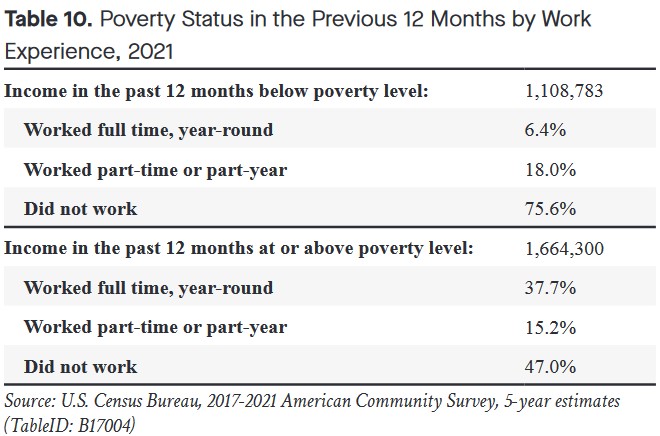
In 2021, the median earnings for workers were $17,982 (see Table 9).22 However, the median earnings for full-time, year-round workers exceeded $25,000.23 Although, holding a job on a full-time basis, year-round, does not guarantee an escape from poverty, it certainly would improve the chances of not living in poverty. About 76% of Puerto Rico’s population 16 years of age and older living below the poverty level did not work, compared to 18% of those who worked part-time or part of the year and 6% of those who worked full-time, year-round (see Table 10).24 Yet, more than 71,000 persons working full-time, year-round (6%) were still living below the poverty level. But as noted, the proportion is greater among those not working. There were an estimated 1,641,000 persons who did not work in the previous 12 months in 2021. The figure declined to 836,000 when limiting the age range between 20 years and 64 years, an age range representing 30% of the working-age population. What is of great concern is the very large proportion of the prime working-age population (25-64 years), more than a third of which did not work in the previous 12 months.25 This profile raises the question of why there are so many prime working-age persons not working in Puerto Rico and specifically whether the economy in Puerto Rico is able to offer employment to all those seeking work.
Puerto Rico’s capacity to create jobs
According to estimates from Puerto Rico’s Department of Labor and Human Resources, the labor force in Puerto Rico was 1,172,000 persons in 2021, of which 1,079,000 were employed.26 This labor force figure from 2021 is a decline of 11 percent relative to the 2009 figure of 1,301,000 individuals.27 In 2008, Puerto Rico’s Department of Labor had established there were 1,117,000 jobs, anticipating an increase of 5% (1,177,000) by 2018.28 These additional 60,000 jobs envisioned, however, did not materialize. In fact, the opposite is true. Employment has decreased in Puerto Rico since 2008. The number of persons employed was lower in 2021 (1,079,000) than in 2009 (1,102,000).
In 2020, updated employment projections by Puerto Rico’s Department of Labor indicated that there were 977,700 jobs.29 These revised projections represent a decline of 139,300 jobs from those reported for 2008. Moreover, the projections from 2020 expected a growth of 10% by 2030 to 1,079,400 jobs. These projected jobs by 2030 are still lower than the extant jobs in 2008. Given these projections between 2008 and 2018 and between 2020 and 2030 that anticipated about 1.1 million jobs, it is not clear how Puerto Rico’s economy, as currently structured, may be able to absorb the 836,000 persons between the ages of 25 and 65 not presently employed, in addition to the 1.1 million that are presently employed. Moreover, it is unclear that Puerto Rico’s economy may create and sustain a total of 2 million jobs and do so at levels of compensation that will not result in 6% or more of the population living below the poverty level even as they work full-time year-round as it happens currently.
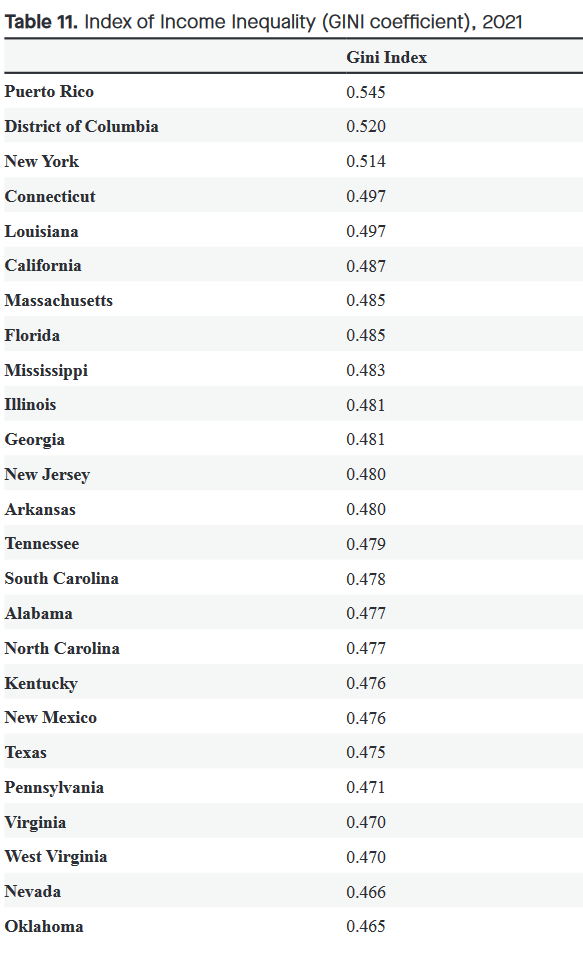
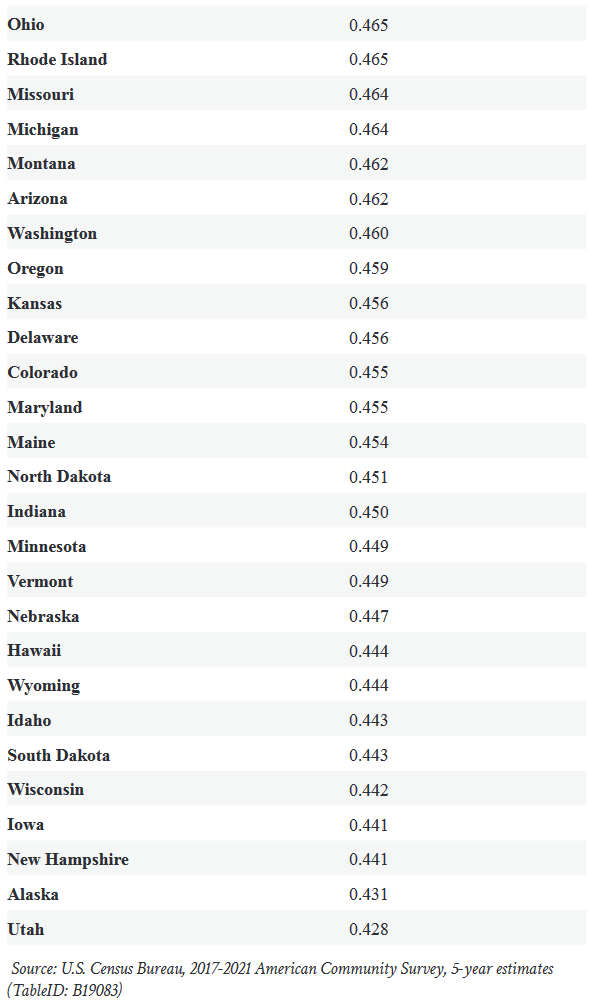
Puerto Rico’s economy is stymied in its capacity to create jobs that are well remunerated in order to reverse long-standing poverty trends in Puerto Rico. It is also unable to distribute the income created in an equitable manner. Puerto Rico has a higher rate of income inequality than any other U.S. jurisdiction, with a 2021 GINI index rate of .545 compared with the national average of .482 (see Table 11).30 This means that the distribution of the wealth that does exist in Puerto Rico is extremely concentrated, underscoring widespread poverty. While many argue that the United States has an untenable distribution of wealth with only 10% of households earning over $200,000 a year, in Puerto Rico only 1.4% of households make over $200,000 a year. Meanwhile, poverty is widespread: 25% live with incomes of $10,000 a year or less (as compared to 6% in the general US).31
Political Status and Stagnation of Current Development Policies
In his 2016 analysis of poverty in Puerto Rico, political economist Héctor Cordero-Guzmán stated:
Poverty and employment are intimately related and there are a number of reasons for these trends that have to do with: 1) the limitations of economic development policies and job creation initiatives; 2) the absence of a concerted set of anti-poverty strategies; and 3) a set of additional social, economic, and political challenges that impact education, employment and the generation and distribution of income and that Puerto Rico needs to better understand, work through, and develop strategies and policies to solve.
The capacity of Puerto Rico’s economy to create sufficient and appropriately remunerated jobs is undoubtedly tied to extant economic development policies and the exhausted condition of those policies. The model of an export-oriented economy promoted by deep fiscal incentives appears to have run its course. Moreover, these policies are structurally and institutionally tied to the political relationship between Puerto Rico and the United States, and Puerto Rico economy’s location in the regional and world markets.
Two salient congressional interventions in recent times that have produced an inordinate negative impact on Puerto Rico’s economy are the phase-out and ultimate sunset of Internal Revenue Code section 936 (1996-2006) and the imposition of a financial oversight and management board in 2016 (PROMESA). The former set the stage for the precipitous economic decline from which Puerto Rico has yet to recover; the latter has created the conditions that have worsened the economic circumstances of the middle and working classes.
The full sunset of IRC section 936 in 2006 marked the beginning of Puerto Rico’s present economic decline. Its expiration deprived the economy of the liquidity it enjoyed as U.S. corporations that temporarily retained their profits in Puerto Rico fueled local lending and capital investment. Furthermore, federal tax deferment or exemption from federal taxes these corporations enjoyed provided a leading incentive for the creation of high-paying jobs for a relatively small segment of Puerto Rico’s labor force that is highly educated and skilled and with an outsized purchasing power. (Puerto Rico’s leading economic comparative advantage in developing its economy relative to states in the United States and countries in the Caribbean Basin is its educated and skilled bilingual workforce.)
As the accompanying graph indicates, Puerto Rico’s economic activity peaked in 2005, and it started to decline as the tax benefits from section 936 disappeared. (Puerto Rico went into recession in 2006, two years before the Great Recession began in the United States.)

Another competitive advantage that Puerto Rico’s economy enjoyed relative to other countries in the Caribbean Basis—unrestricted entry of goods into the U.S.—largely disappeared with additional congressional interventions: the passage of the North American Free Trade Agreement (NAFTA) in 1989 and the Dominican Republic-Central American Free Trade Agreement (CAFTA-DR) in 2005, which allowed signatories countries similar barrier-free entry of goods to the U.S. market. Puerto Rico is therefore presently without much comparative advantage relative to the U.S. states and foreign countries in its periphery by political actions beyond its direct control.32
The declining economy in Puerto Rico, along with less-than-stellar Commonwealth government actions over two decades, left the government insolvent. Congress intervened with PROMESA. La Junta that has been imposed without much oversight from Congress since 2016 has demanded austerity measures, which have fallen disproportionately on those most dependent on the local government provision of services and funding: children, the elderly, the poor at-large, retirees dependent on government pensions as well as local municipal governments. At the beginning of La Junta’s jurisdiction, Puerto Rico’s economic activity had fallen to the same level it experienced in 1993. After the devastating hurricanes in 2017 and earthquakes in 2020, the economy has declined even further to levels last seen in 1992. The Puerto Rico economy has regressed three decades, in no small measure due to federal intervention.
While there is some momentum to change the political relationship between Puerto Rico and the United States, the likelihood this will take place in the short-term is small. Under those circumstances, public policy is likely to be established under the present territorial arrangement. But irrespective of the political formula to reign the political destiny of Puerto Rico, to address the inordinate poverty levels in Puerto Rico, its economy must be able to produce enough jobs to employ as many individuals as are able to work (e.g., through education and training), and provide a safety net for those unable to join the labor force.
Conclusion
Poverty in Puerto Rico is deeply structural. It is, moreover, rooted in its political relationship with the United States, which relegates it to a second-tier of attention from federal policymakers, and grounded in Puerto Rico’s position in the regional economy and the economy of the United States. Puerto Rico has lost ground in the regional economy as a result of expanded multi-national free trade agreements negotiated by the United States that have reduced or eliminated barriers to exports to the United States for countries in the vicinity of Puerto Rico. Moreover, Puerto Rico has become less attractive to investors from the United States as a result of changes in the federal tax code. Consequently, Puerto Rico’s comparative competitive advantage, which had allowed it to grow tremendously in the last third of the twentieth century, has dissipated. This reality leaves policymakers in Puerto Rico with limited choices to develop an economy that may accommodate 2 million workers. Attempts by local policymakers to spur investment in Puerto Rico through exemption of local taxes (e.g., Law 20 and Law 22) have been insufficient to create meaningful employment. Poverty in Puerto Rico will be meaningfully alleviated when greater employment opportunities among the working age groups, and particularly among women, is fostered.
Over the past decades, Puerto Rico’s political economic conditions have been dependent on the actions of the U.S. Congress, in which Puerto Ricans are allowed to provide little substantive input. They have nevertheless borne an inordinate burden of the consequences. Therefore, it is incumbent upon the United States government to address these pervasive poverty conditions in its colony. The U.S. Supreme Court has recently decided that Congress can continue to treat Puerto Rico differently from a state of the union since it is not subject, among other things, to the Constitution’s Uniformity Clause.33 But this should not imply that Congress should continue to treat Puerto Rico worse than a state. Congress can continue to treat Puerto Rico differently than a state by treating it better than a state, in order to address the devastating economic and social conditions its previous actions have wrought.
References
1 https://sgp.fas.org/crs/misc/R45100.pdf
2 Data for this report derive mostly from the U.S. Census Bureau, 2017-2021 American Community Survey (ACS), 5 year-estimates. The 5-year estimates aggregate survey data results over the previous 5 years.
3 Data for U.S. territories derive from the 2020 Decennial Census of Island Areas. Those for Puerto Rico derive from the Puerto Rico Community Survey, 2017-2021 (5-year estimates).
4 Moreover, extant government-collected and -reported data are not always comparable as they do not measure exactly the same variable at the same level of analysis. For instance, the data collected in table DP3 in the decennial survey of island areas for 2020, in all island territories but Guam, all households were included when calculating median household income. However, in Guam, some households were excluded because of data collection issues (e.g., they excluded military housing units). Thus, the universes are not comparable—they’re not referring to the same populations. For determining poverty, the Commonwealth of the Northern Mariana Islands considered all individuals. The U.S. Virgin Islands and American Samoa considered individuals in households. For Guam, all individuals in households, excluding people in military housing units, were considered.
5 Cordero-Guzmán, Héctor. 2016. Poverty in Puerto Rico in Historical and Contemporary Perspective. In Poverty in Puerto Rico: A Socio-economic and Demographic Analysis with Data from the Puerto Rico Community Survey, edited by Carmen Nazario. San Juan, PR: InterAmerican University of Puerto Rico, Metro Campus.
6 Vargas-Ramos, Carlos. 2016. Some Social Differences on the Basis of Race among Puerto Ricans. Centro Research Brief (RB2016-10). New York: Center for Puerto Rican Studies, Hunter College CUNY. https://centroprarchive.hunter.cuny.edu/sites/default/files/data_briefs/RB2016-10_RACE.pdf
7 Limiting the comparison to those who live below the poverty level, 55% of the poor are female, while 45% of the poor are male. Women represented nearly 53% of Puerto Rico’s population.
8 Of those who live at or above the poverty level, 51% are female, while 49% are male.
9 These proportions on poverty along racial categories based on 5-year estimates (2017-2021) do not differ notably from those reported in 2014 (see footnote 6). However, 1-year estimates of poverty by race do show significant differences between 2021 results and those between 2010 and 2019. A partial explanation for this discrepancy is the sudden and remarkable change in racial identification
between 2010 and 2021 in Puerto Rico. Whereas between 2010 and 2019, the majority of the population had identified as white (fluctuating between 66.2% and 71.8%), by 2020 that proportion had precipitously declined to 17% and to 28% in 2021. Correspondingly, the proportion of the population that identified using more than one racial category increased from 13.4% in 2010 to 35.8% in 2021; while the proportion of persons identifying with some other racial category beyond those provided by the Office of Management and Budget increased from 10.7% in 2021 to 29.7% in 2021. These changes in the racial identification are having an impact on the sorting of other socio-demographic variables.
10 Velazquez Estrada, Alberto. 2016. Socio-demographic analysis of households by regions and poverty levels in Puerto Rico: 2007-2011. Poverty in Puerto Rico: A Socioeconomic and Demographic Analysis with Data from the Puerto Rico Community Survey, edited by Carmen Nazario. San Juan, PR: Inter American University of Puerto Rico, Metro Campus.
11 For a recent related report from the U.S. Census Bureau, refer to https://www.census.gov/content/dam/Census/library/publications/2023/acs/acs-51%20persistent%20poverty.pdf This recent Census Bureau report regrettably does not include Puerto Rico.
12 The corresponding proportion of the overall U.S. population living below the poverty level was 3% among children less than 1 year of age and 17.
13 In 2021, the Census Bureau estimated there were 597,277 children in Puerto Rico. Poverty was determined for 593,300 of them. The Census Bureau was also able to determine poverty status for 591,524 related children according to family type (see ACS Table B17006).
14 Households with children under 18 years of age may include children related to the head of household by birth or consanguinity (biological), marriage (step-child) or adoption. But households with children may also include children unrelated to the householder, such as foster children. (See, definitions: https://www2.census.gov/programs-surveys/acs/tech_docs/subject_definitions/2021_ACSSubjectDefinitions.pdf)
15 From a different analytical perspective, 46% of the 307,000 households with children were headed by women without a spouse present; 41% of households with children were households with married couples; 12% of households with children were headed by men without a spouse present.
16 Families with 1 or 2 children represented 35% of all family households in Puerto Rico and 23% of all households in 2021. Families with 3 or 4 children represented 4% of all family households and nearly 3% of all households. Families with 5 or more children represented 0.14% of all family households and 0.09% of all households.
17 Married-couple families with 1 or 2 children represented 15% of all family households in Puerto Rico and 10% of all households in 2021. Families with 1 or 2 children headed by a woman with no spouse present represented 16% of all family households in Puerto Rico and 10% of all households. Married couple families with 3 or 4 children represented 1.3% of all family households in Puerto Rico and 0.9% of all households. Families with 3 or 4 children headed by a woman with no spouse present represented 2% of all family households in Puerto Rico and 1.4% of all households.
18 By way of comparison, 2021 estimates for the United States, Mississippi and New Mexico indicate that 63%, 57% and 57% of the population 16 years and older, respectively, were in the civilian labor force (ACS Table DP03).
19 Corresponding estimates for the United States, Mississippi and New Mexico were 36%, 43% and 43%, respectively (ACS Table DP03).
20 Those unemployed persons represented 6% of the population 16 years of age and older (2,797,936) and 14% of the civilian labor force (1,236,011). The number of persons employed was estimated to be 1,055,843.
21 This number represents 66% of those who were employed in Puerto Rico, 57% of those in the civilian labor force, and 25% of the population 16 years of age and over (See ACS Table B23027 and DP03). In comparison, the 933,000 persons working full-time, year-round in Mississippi represented 75% of those employed, 70% of the civilian working force, and 40% of the population 16 years of age and older. In New Mexico, the 631,000 people employed full-time, year-round represented 71% of those persons employed, and 66% of the civilian labor force, and 38% of the population 16 years of age and older.
22 Corresponding earnings for the United States, Mississippi and New Mexico were, respectively, $38,732; $31,784; and $31,889.
23 Corresponding earnings for males and females the United States, Mississippi and New Mexico were, respectively, $57,803 (males) and $46,823 (females); $47,379 (males) and $36,128 (females); $49,190 (males) and ($40,568).
24 Corresponding estimates for the United States were 61%, 30% and 9%, respectively; for Mississippi, 65%, 24% and 11%, respectively; and for New Mexico were 63%, 27% and 10%.
25 The comparable proportions in Mississippi and New Mexico were 22%.
26 The data for this section of the report derive from surveys conducted by Puerto Rico’s Department of Labor and Human Resources, not the U.S. Census Bureau: https://www.mercadolaboral.pr.gov/lmi/pdf/Grupo%20Trabajador/2023/EMPLEO%20Y%20DESEMPLEO%20EN%20PUERTO%20RICO%204.pdf. Results therefore may differ from those reported in the American Community Survey and/or the Puerto Rico Community Survey, both conducted by the U.S. Census Bureau. Puerto Rico’s Department of Labor and Human Resources conducts its own survey of economic conditions because the U.S. Department of Labor does not include Puerto Rico as a covered jurisdiction for its Current Population Survey series.
27 https://www.mercadolaboral.pr.gov/lmi/pdf/Grupo%20Trabajador/2019/EMPLEO%20Y%20DESEMPLEO%20EN%20PUERTO%20RICO%2012.pdf This decline in the labor force in Puerto Rico between 2009 and 2021 was not necessarily unexpected given the decline in total population (16 years of age and older), which was 9.7% during the same period. The year 2009 was one year into the Great Recession of 2008, whose effects were felt in Puerto Rico beginning in 2006, with a corresponding decline in population.
28 https://estadisticas.pr/Documentos/A1107D00-A459-4FC4-9F83-4EAE2D4E67E8/PUBLICACION_PROYECCIONES_A_LARGO_PLAZO_2008_2018.pdf
29 https://www.mercadolaboral.pr.gov/LMI/pdf/Proyecciones/Puerto%20RicoProyecciones%20a%20Largo%20Plazo%20por%20Ocupaci%c3%b3n.pdf
30 U.S. Census Bureau, 2017-2021 American Community Survey, 5-yr estimates (TableID: B19083)
31 U.S. Census Bureau, 2017-2021 American Community Survey, 1-yr estimates (TableID: CP03)
32 Green, Claudia. 1997. Industrial Policy for Puerto Rico and the Implications for Political Status. Boletín de Economía 2(4), 6-22 Río Piedras, PR: Unidad de Investigaciones Económicas, Departamento de Economía, Universidad de Puerto Rico.https://sociales.uprrp.edu/economia/wp-content/uploads/sites/15/2016/11/vol-2-num-4.pdf
33 United States v. Vaello-Madero, 20-303, 2022.
Authors
- Jennifer Hinojosa
- Yarimar Bonilla
- Carlos Vargas-Ramos
- Laura Colón Meléndez
- Jorge R. Soldevila Irizarry
- Damayra I Figueroa-Lazu