Hispanic Empowerment in New York’s Municipal Workforces, 2021
Sections
Key Takeaways
Introduction
New York City’s Full-Time Municipal Government Workforce
The Structure of Municipal Employment in New York City
New York State’s Full-Time Municipal Government Workforce
References
In memoriam, Angelo Falcón
Key Takeaways
- Employment in municipal government is another facet of empowerment and incorporation for populations that have been historically underrepresented in government as are Hispanics
- Hispanics made up 21% of New York City municipal government full-time workers, and nearly 14% of full-time workers in municipal and state governments in 2021
- Hispanics were underrepresented as employees of New York City’s municipal government
- Hispanic were particularly underrepresented in city government job categories that generally pay higher salaries and have greater administrative responsibility
- Hispanic underrepresentation in job categories with higher pay and more responsibility was present even in service function agencies in which there were more Hispanics (e.g., protective services: NYPD, FDNY)
- Hispanics were also underrepresented as employees of municipal governments throughout New York State and well as in New York State government
- As in New York City municipal government, Hispanics statewide were underrepresented in municipal and state government job categories that generally pay higher salaries and have greater administrative responsibility
- Hispanic underrepresentation in government job categories that pay higher salaries and have greater administrative responsibility tended to be narrower than it is among Hispanics in New York City municipal government
- As in New York City municipal government, Hispanics statewide were underrepresented in municipal and state government job categories that generally pay higher salaries and have greater administrative responsibility
Introduction
One of the markers of political empowerment of historically marginalized groups in society is not simply the election and appointment of representatives from those groups to governmental institutions; their participation as employees and contractors in the governmental apparatus that provides services and goods to residents of towns, cities and counties also reflects the levels at which members of the community are included and represented. New York City has the largest municipal workforce in the country. New York is also one of the most socially diverse communities in the United States. Yet, as varied as New York City’s municipal workforce is, it still reflects the disparities evident in our society. The present report provides an analysis of New York City’s municipal workforce, with special emphasis on the location of Hispanics within it. It shows some progress, but also the need for greater improvement, particularly in those areas where there is a meaningful impact on the decision-making apparatus that decides on the allocation of municipal resources.
The City of New York1 reported its municipal workforce exceeded 373,000 employees in fiscal year 2021, with 93% working on a full-time basis.2 It further reported that the racial and ethnic makeup of this government’s workforce was 36% white, 29% Black, 22% Hispanic, 10% Asian, and 3% of some other race. In order to gauge how representative or unrepresentative this actual racial and ethnic personnel makeup is to its population base, the City of New York uses the “total employed population” as a benchmark for comparison.3 Overall, New York City’s total employed population was 35% white, 18% Black, 27% Hispanic, 14% Asian and 6% of some other race. By this measure, the Hispanic population is notably underrepresented in New York City’s government personnel, along with the Asian population.4 In comparison, the non-Hispanic white population is slightly overrepresented in city employment, while the Black population is notably overrepresented in it.
However, these ethnic and racial disparities in employment in the municipal government’s workforce do not capture wider differences that exist along race and ethnicity within municipal employment in New York City. New York City government’s workforce is not just very large but also varied and complex in work functions and job titles. Insight into this variety and complexity of work functions is reflected in the salary earned by NYC government employees, in which differences in terms of race and ethnicity are also evident. While the median annual salary among full-time employees was $80,440 in FY21, salaries ranged between $130,351 at the high end (95th percentile) and $38,287 at the lower end (5th percentile).5 A closer analysis by job category and function reveals even greater discrepancies in employment within the municipal labor force by ethnicity and race.
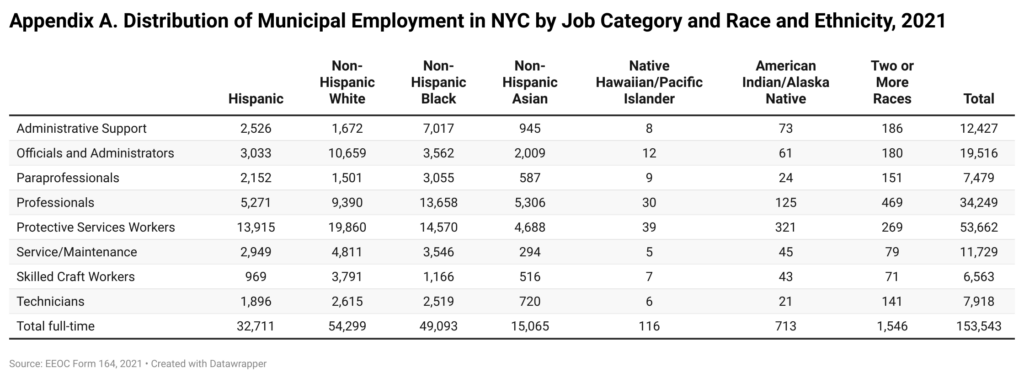
The City of New York provides the U.S. Equal Employment Opportunity Commission with a report (i.e., EEOC Form 164) that itemizes its employment data every two years.6 For FY21, the last year for which data are available, the City of New York reported 153,543 full-time employees, distributed along eight job categories: administrative support, officials and administrators, paraprofessionals, professionals, protective services workers, service/maintenance workers, skilled craft workers, and technicians.7 For the remainder of this report, we use the data reported by the City of New York to the U.S. Equal Employment Opportunity Commission (EEOC) in EEOC Form 164 for 2021, supplemented with data from the U.S. Census Bureau for comparison purposes.
New York City’s Full-Time Municipal Government Workforce
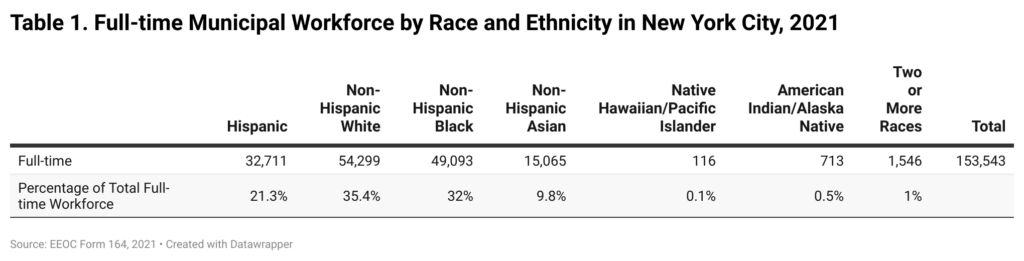
Of the more than 153,000 full-time employees that the City of New York reported to the EEOC in 2021, the largest single racial or ethnic group is that of non-Hispanic whites, making up 54,299 employees (35.4%), followed by 49,093 non-Hispanic Blacks (32%), 32,711 Hispanics 21.3%), and 15,065 Asians (9.8%) (see Table 1). Native Americans, Native Hawai’ians, Other Pacific Islanders, Alaska Native or those of two or more races collectively represented less than two percent of the full-time municipal government workforce.
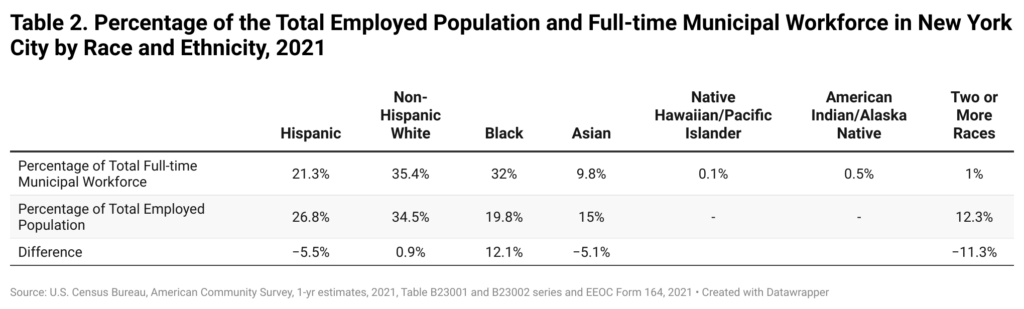
Following the City of New York’s convention of using the “total employed population” as a benchmark for comparing its personnel composition, we use this variable derived from the one-year estimates of the American Community Survey (see Table 2). By this measure, and as noted by the City of New York’s own workforce report, we find that non-Hispanic whites were slightly overrepresented in the municipal workforce compared to their proportion in the employed population (34.5%). Blacks were notably overrepresented in the municipal workforce (32%) as they represent 19.8% of the total employed population. Hispanics were underrepresented in the city’s workforce as they represented 26.8% of the total employed population but 21.3% of the municipal workforce.8 Asians were similarly underrepresented, constituting only 9.8% of full-time municipal employees, while they represented 15% of the total employed city’s population.
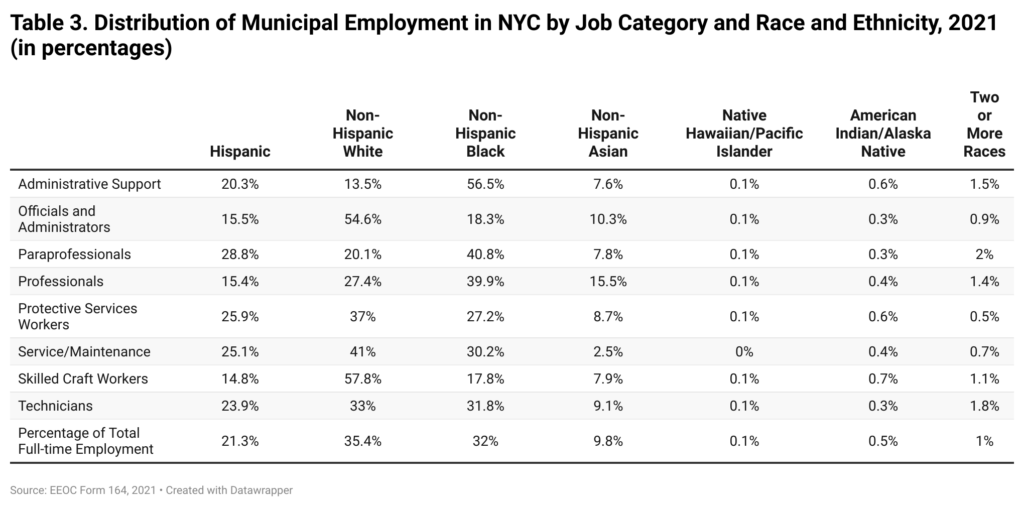
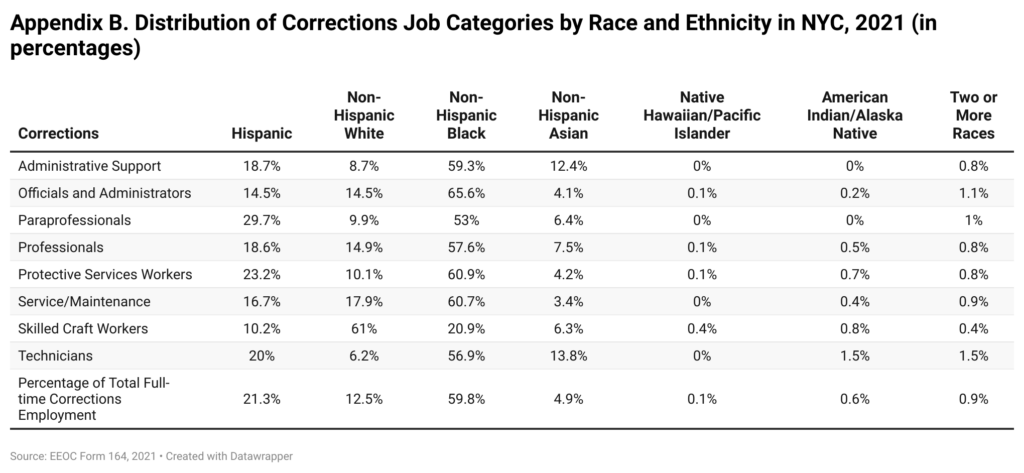
This initial comparison of municipal employment along race and ethnic lines shows some noteworthy variations. However, a deeper look at the composition of job categories by race and ethnicity reveals even larger fluctuations in municipal government employment. For instance, whether one uses the percentage of the total employed population that is Hispanic (26.8%) as a benchmark for comparison or the percentage of the full- time municipal workforce that is Hispanic (21.3%), Hispanics were underrepresented among officials and administrators (15.5%), professionals (15.4%), skilled crafts (14.7%) and administrative support positions (20.3%) (see Table 3). There is only one job category in which Hispanics were overrepresented—paraprofessionals (28.8%). In other job categories (i.e., technicians, services and maintenance, and protective services), Hispanics exceeded their overall proportions in the municipal workforce, but remained underrepresented as a percentage of their total city employment.
There are two concerns with this underrepresentation of Hispanics in the municipal workforce. One is that Hispanics are disproportionately less likely to enjoy the benefits of municipal employment overall. But, more insidiously, given their greater underrepresentation in the job categories with the highest salaries in municipal employment (i.e., officials and administrators, professionals, and skilled crafts), Hispanics benefit financially even less from municipal employment. The bulk of employees in these high-earning job categories earned a salary of $70,000 or more a year.9 Among paraprofessionals––the one job category in which Hispanics were slightly overrepresented––, 61% made less than $55,000 a year in salary, with the bulk making between $43,000 and $54,900.
By way of comparison, non-Hispanic whites were overrepresented (more than 35%) in some of the higher paying job categories (i.e., officials and administrators [54.6%] and skilled crafts [57.9%]) but underrepresented in the lower paying job categories (i.e., paraprofessionals [20.1%] and administrative support [13.5%]) (see Table 3).10 For Asians, there was virtually no overrepresentation in any job category. Asians were on par with their proportion in the total employed population (15%) in the professional job category, and underrepresented in all other job categories, both in the high-paying as well as the low-paying categories. Non-Hispanic Blacks were generally overrepresented in administrative support, paraprofessionals, and professionals job categories, and underrepresented as officials and administrators, in protective services and skilled craft categories, when using their overall percentage in the municipal workforce as the basis for comparison. When using the total employed population as a benchmark, non-Hispanic blacks were overrepresented in all job categories, save officials and administrators and in skilled crafts, in which they are slightly underrepresented.
Tables 4 and 5 show detailed levels of overrepresentation and underrepresentation of different racial and ethnic groups. The differences are based on two measures: the disparity between their percentages in each job category and their overall percentage in the municipal workforce (i.e., Table 4)––for instance, 21.8% for Hispanics––and the disparity between their percentage in the total employed population in New York City and their percentage in a particular job category (i.e., Table 5)–for instance, 26.8% for Hispanics in 2021.
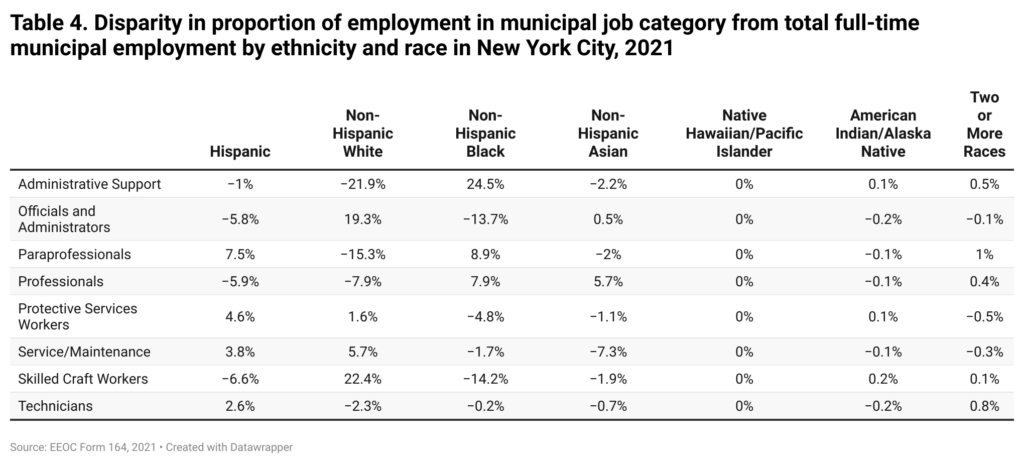
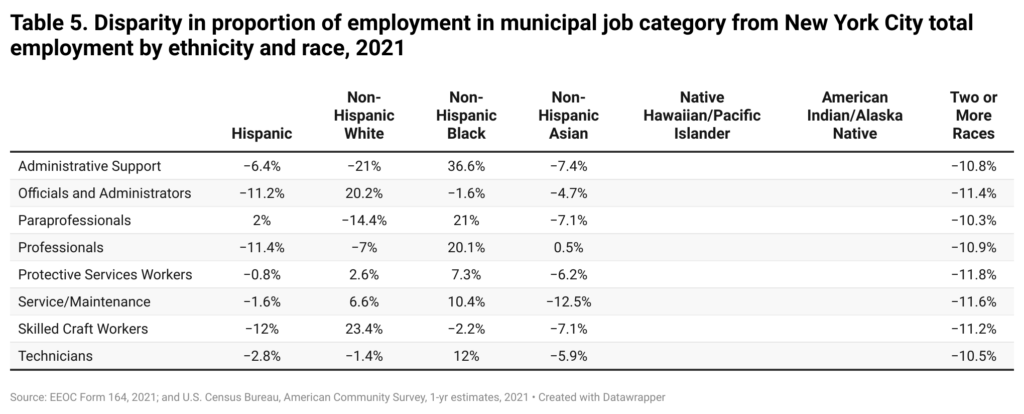
From these results we can observe that, based on the total employed population in New York City, Hispanics are consistently underrepresented in all job categories (except paraprofessionals) (see Table 5). This underrepresentation is glaring relative to non-Hispanic white and non-Hispanic black municipal employees in New York City. When using as measure of comparison the overall proportion of Hispanics in the municipal workforce (see Table 4), a measure that already exhibits an underrepresentation of Hispanics in the municipal workforce, we observe a sizable underrepresentation of Hispanics in job categories that require either more skills, educational attainment, or credentials, and that correspondingly provide higher salaries (e.g., professionals, officials, and administrators). In contrast, Hispanics are overrepresented in job categories with lower salary scales (e.g., service and maintenance, technicians, and paraprofessionals).
From a public policy perspective, we can view these data from slightly different vantage points: one in which the City of New York may take a neutral and passive position as an employer, simply recruiting and employing from the existing labor pool, or, from a more purposive perspective, as an employer who may want to proactively promote an equitable representation of the different segments of New York City society in its municipal employment roster. But the City of New York is not simply an employer. Unlike other employers, particularly in the private sector, the City of New York controls the biggest training and vocational institutions: the public education system at its primary, secondary and tertiary levels. It therefore has the responsibility as well as the capacity or potential capacity to shape a labor force that suits its needs as an employer and provider of municipal services. It is from this purposive perspective that the role of education from a public policy, management or political perspective becomes salient.
The Structure of Municipal Employment in New York City
Race and ethnicity are relevant variables in the distribution of workers in New York City’s municipal government, presumptively as a result of their different levels of skill and experience upon hiring. Another issue in which race and ethnicity appear to have an impact is in the opportunity to acquire new skills and deploy those skills in positions of greater responsibility and complexity that result in greater remuneration once municipal workers are part of the staff. An analysis of the position of Hispanic workers as protective services employees offers insights in this regard.
The largest job category among all full-time municipal employees reported by the City of New York to the EEOC was that of protective services workers, at 35%, followed by professionals (22%), and officials and administrators (13%) (see Table 6). An additional 8% of the municipal workforce provided administrative support, another 8% provided services and maintenance, 5% were technicians, another 5% were paraprofessionals, and 4% were skilled craft workers.
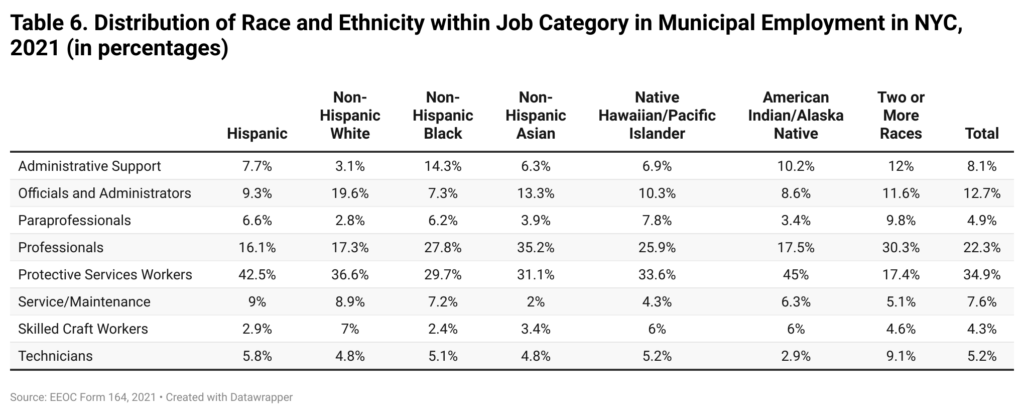
The structure of Hispanic employment in municipal government resembled the distribution of the overall municipal workforce. The largest full-time municipal job category among Hispanics was also that of protective services, followed also by professionals, and then officials and administrators. What varied was the distinct proportions in which Hispanics are represented in these job categories. Forty-three percent of full-time Hispanic workers were in the protective services job category. But this proportion of Hispanic employment in protective services was higher than it was for the municipal workforce overall (35%). On the other hand, the proportion of Hispanic municipal workers in the second most common job category (i.e., professionals) was lower (16%) than it was for the municipal workforce overall (22%). Similarly, officials and administrators may have been the third most common job category for Hispanics (9.3%), but their participation in that job category was also at a lower rate than it was for the municipal workforce as a whole (13%).
Protective services was also the largest category of municipal employment for both non-Hispanic whites and Blacks. But whereas for non-Hispanic whites their percentage of employment in this category (36%) was proportional to their percentage of all full-time municipal workers (35%), Blacks were underrepresented (30%). Asians were slightly underrepresented in this job category (31%), but just as noteworthy is that Asians were most employed in the category of professional jobs (35%). Professional jobs was the second most numerous category among full-time municipal employment and it was also the second most numerous category for Black municipal employees. However, for non- Hispanic whites, the second order job category was officials and administrators (20%), which was the third order job category among all municipal employees (13%).
Protective services municipal employees are of course concentrated mostly in the police department, but also in the fire and correction departments. These three agencies contained more than 95% of all New York City protective services workers in 2021. The NYPD employs 66% of those workers; FDNY, nearly 16%; DoC, nearly 14%. A closer analysis of employment distribution within police protection agencies (e.g., NYPD) reveals that Hispanics represented close to 27% of all full-time employees; non-Hispanic whites represented nearly 37%; Black employees were 25% of the workforce; and Asians represented about 11% (see Table 7).
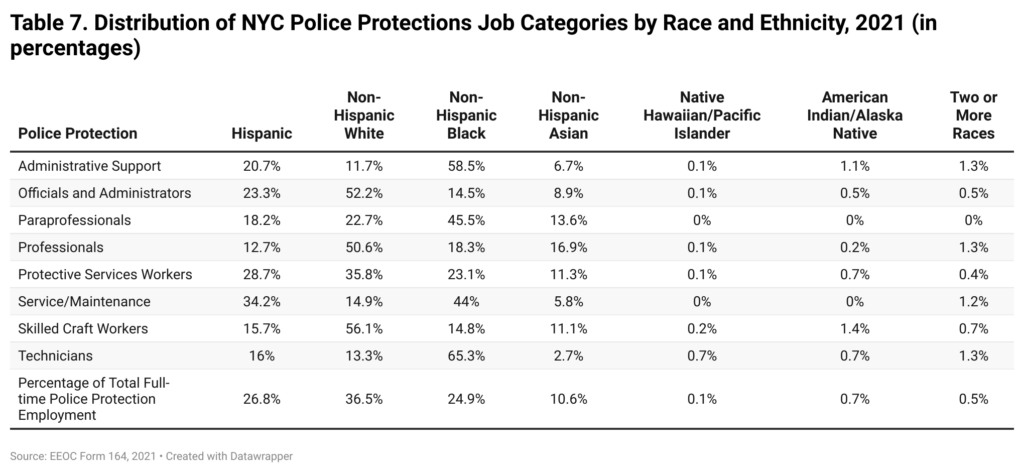
Nearly 29% of Hispanics in police protection services worked specifically as police officers, but a greater proportion (34%) worked in service and maintenance occupations, while 23% were officials and administrators. In contrast, 36% of non-Hispanic white employees in police protection services worked as police officers, a proportional ratio relative to all job categories within police protection services. However, non-Hispanic whites were disproportionately overrepresented (52%) as officials and administrators and in professional jobs (51%). Non- Hispanic Blacks were nearly proportionally represented as police officers (23%), but as with Hispanics, they were overrepresented in services and maintenance occupations (44%), notably overrepresented in administrative support (59%) and as paraprofessionals (46%), but notably underrepresented as officials and administrators (15%).
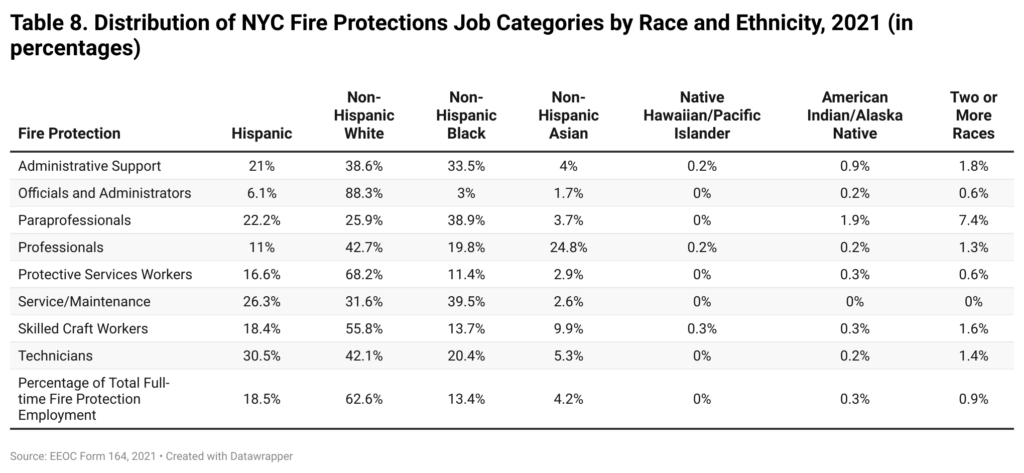
These disparities in the structure of employment within the protective services agencies are starker for fire protection. As evident in Table 8, Hispanics represented less than 19% of all full-time fire protection employees, less than 17% of firefighters, 11% of professionals, and 6% of officials and administrators. Similarly, 11% non-Hispanic Blacks were firefighters, while representing 13% of all full- time fire protection employees, and 3% of officials and administrators. Non-Hispanic whites represented 63% of all full-time fire protection employees, 68% of firefighters, and 88% of officials and administrators.
The recent appointment of Edward Cabán to lead the city’s police force is an indication of the existing and growing pool of talent among Latino municipal workers. The fact that it has taken until 2023 for such a prominent appointment speaks to the glacial pace at which the talent of the Hispanic community garners attention. This may also be related to the dearth of opportunities for Hispanics (as well as non-Hispanic Blacks) to acquire new skills and deploy those skills in positions of greater responsibility and complexity, and the dearth in the mentorship that is often needed to ascend in the ranks of the municipal workforce.
New York State’s Full-Time Municipal Government Workforce
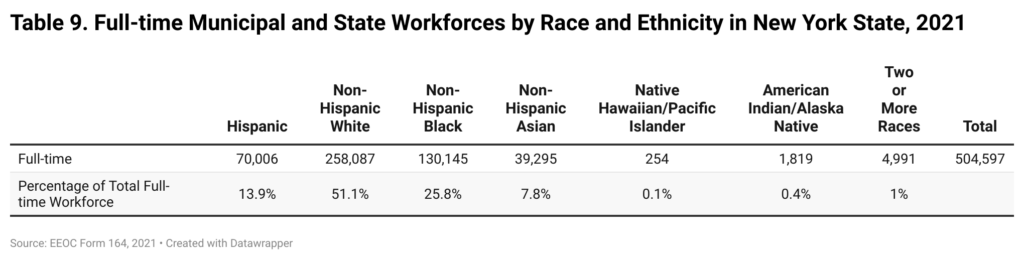
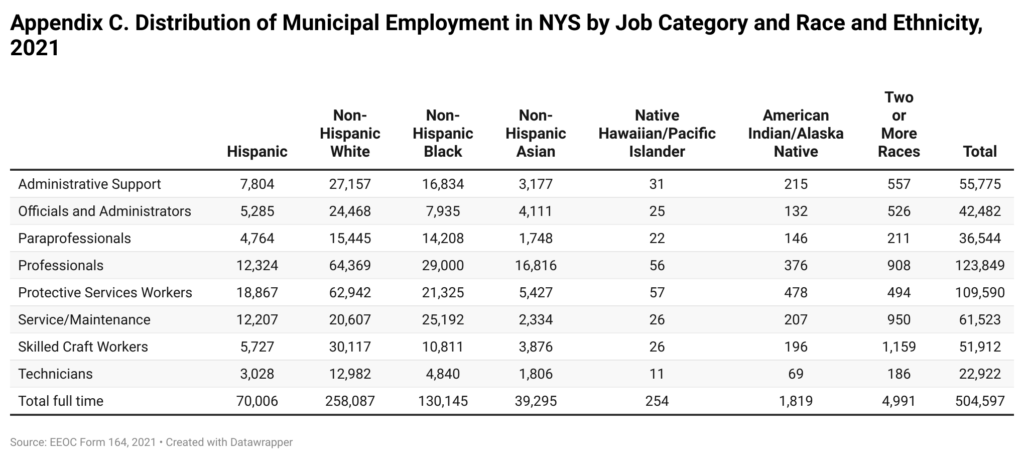
The U.S. Equal Employment Opportunity Commission also collects employment data for municipalities across New York State (and other states) that employ more than 100 employees. These municipalities and state governments in the state of New York State collectively reported 504,597 full-time municipal employees in 2021, the last year for which data were provided. Non-Hispanic whites made up half (51.1%) of the New York State and local government workforce; Blacks represented 25.8%; Hispanics were 13.9%, and Asians were 7.8% (see Table 9). Persons of two or more races, Native Americans and Native Hawai’ians collectively represented 1.5% of the full- time municipal workforce across New York State.
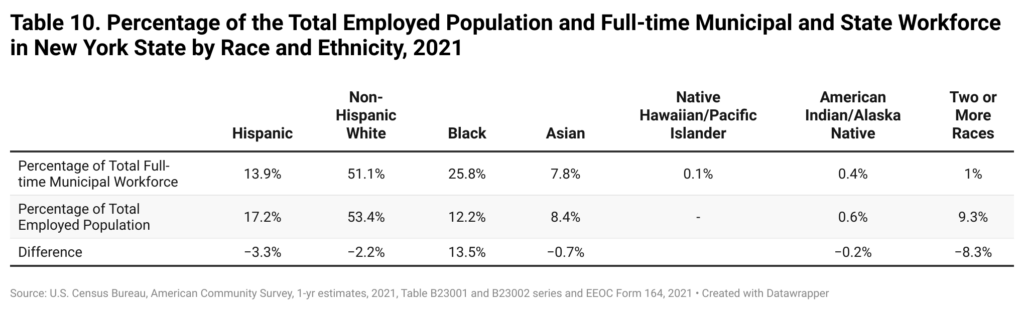
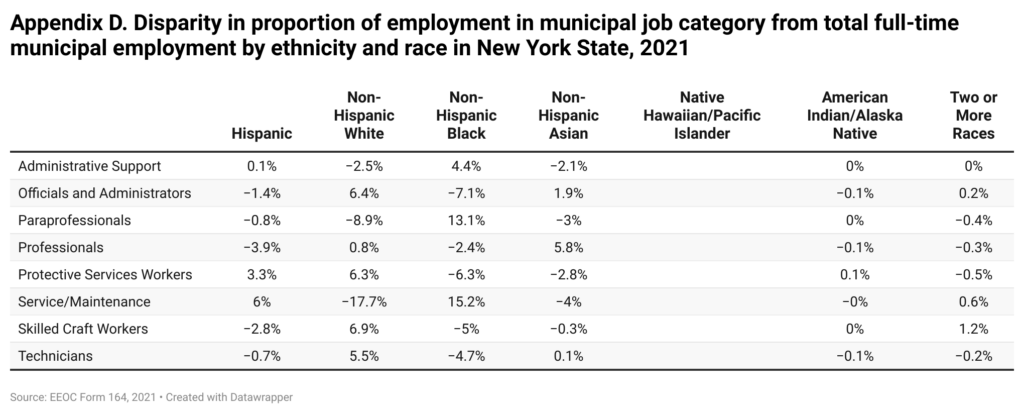
Following New York City’s convention for comparing its municipal workforce composition, we use the total employed population in New York State to determine how proportional is the representation of different ethnic and racial groups in state and municipal workforces across the state of New York. Non-Hispanic whites represented 53.4% of New York State’s total employed population in 2021, Blacks were 12.2%; Hispanics were 17.2%; Asians, 8.4%; persons of two or more races, 9.3% (see Table 10). By these measures, Hispanics were underrepresented in the full-time state and municipal workforces across New York State. Persons of two or more races were substantially underrepresented in government employment; while non-Hispanic whites, Asians, and Native Americans were slightly underrepresented. Blacks were overrepresented among the full-time local and state government workforce. In terms of the structure of municipal state employment for Hispanics across the state, they were underrepresented in higher salary job categories and overrepresented in lower salary job categories, as was the case in New York City. Therefore, the proportion of Hispanics was lower among professional (10%) and skilled craft job categories (11%), while it was higher in services and maintenance (19.8%), when using their overall proportion of municipal and state employment statewide (see Table 11). The disparities in proportions for Hispanics were slight for the administrative support (14%), paraprofessional (13%), and technicians job categories (13.2%). Hispanics were overrepresented (17.2%) in the protective services categories. However, the underrepresentation in municipal employment is markedly larger for Hispanics across most job categories when using their rate of total employment (17.2%).
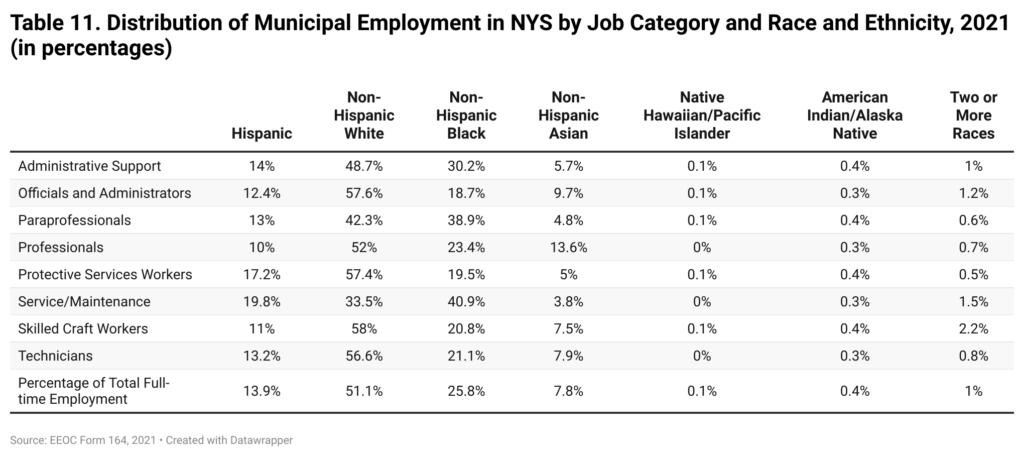
As was the case in New York City, non-Hispanic whites were overrepresented in the official and administrators (57.6%) and skilled craft job categories (56.6%), as well as protective services (57.4%) and technicians job categories (56.6%), using their overall proportion of statewide municipal employment. They were underrepresented in services and maintenance (33.5%) as well as paraprofessional job categories (42.3%). Black employees were notably overrepresented in services and maintenance (40.9%) and paraprofessional job categories (38.9%) as well as in administrative support (30.2%), but underrepresented in the officials and administrators (18.7%), protective services (19.5%), and skilled craft job categories (20.8%). Asian employees were overrepresented in the professional (13.6%) and officials and administrators job categories (9.7%), but underrepresented in the services and maintenance (3.8%) and paraprofessional job categories (4.8%) as well as protective services (5%).
The disparities in workforce representation were not as wide at the state level as they were among New York City full-time employees, with the exception of the service and maintenance job category. This is because the proportion of Hispanic employees across municipalities in New York State is smaller (13.9%) than it is specifically in New York City (21.3%). Since the proportion of Hispanic full-time municipal workers is smaller in municipalities across the state, the threshold for parity is lower. But this difference between the city and state levels might also be due to the fact that there may be a wider range of job categories and occupations available for Hispanics throughout governments in the State of New York, whereas these opportunities are more constrained in New York City, where there seems to be a bottleneck.

References
1 The City of New York is the official name of the municipal corporation that governs New York City, and in this report it refers specifically to its municipal government.
2 Fiscal Year 2021 NYC Government Workforce Profile Report: Workforce at a Glance. New York City: Department of Citywide Administrative Services. Downloaded June 5, 2023: https://www.nyc.gov/ assets/dcas/downloads/pdf/reports/nyc-government- workforce-profile-report-fy-2021.pdf
3 The total employed population is the total number of persons, 16 years of age and older, in the civilian labor force who are employed in a given jurisdiction.
4 An alternative benchmark for comparison is the civilian labor force participation rate, which measures the proportion of the population 16 years of age and older employed in the civilian sector as well as the number of persons who are out of work but seeking employment. Given the larger proportion of the population in the civilian labor force, as opposed to simply the proportion of the employed population, Hispanic underrepresentation in the municipal workforce is even greater when using the civilian labor force participation measure (6.2 percentage points instead of 5.5 percentage points when using the total employed population figure).
5 As a point of reference, the U.S. Department of Housing and urban Development established the area median family income in the NYC metro area to be $81,700 in FY21, with poverty thresholds for a family of 4 persons at $95,450 (low income), $59,650 (very low income), and $35,800 (extremely low income). https://www.huduser.gov/portal/datasets/il/ il2021/2021summary.odn, downloaded June 5, 2023.
6 https://www.nyc.gov/assets/dcas/downloads/pdf/ reports/workforce_nyc_2021_eeo_4_report.pdf.
7 While the cited Workforce Profile Report includes data of all municipal employees, including employees of the Department of Education, the EEO-4 report used in the present analysis does not appear to include all such municipal employees.
8 Hispanics were 27.5% of the New York City civilian labor force in 2021. By this measure, Hispanic underrepresentation in the municipal workforce was 6.2 percentage points rather than 5.5 percentage points lower than when simply using their share of the total employed population.
9 Nearly 97% of officials and administrators, 77% of professionals, and 88% of skilled craft workers earn an annual salary of $70,000 or more, the highest salary category reported.
10 Among administrative support workers, 62% make less than $55,000 a year; 38% make more than $55,000 per year.